|
|
Post by tyrbiter on Apr 22, 2024 12:47:38 GMT
It is interesting that the large southern hemisphere spot group that was counted as a single group on the previous rotation has now been split into 5 or 6 groups with the associated increase in SN of 40 or 50.
I understand that this is probably due to magnetic field changes but the SFI has not closely followed the SN curve.
|
|
|
|
Post by acidohm on Apr 22, 2024 16:58:25 GMT
It is interesting that the large southern hemisphere spot group that was counted as a single group on the previous rotation has now been split into 5 or 6 groups with the associated increase in SN of 40 or 50. I understand that this is probably due to magnetic field changes but the SFI has not closely followed the SN curve. This complex TB??  Sunspots have negative and positive polarity aspects to them and often appear binary. The orientation is normally constant too, reverse polarity spots are rare. Sunspot regions which survive complete solar rotations are also not common, in this case this area has been very active, and as it developed, multiple distinct spots can probably be identified? |
|
|
|
Post by tyrbiter on Apr 23, 2024 12:20:53 GMT
It's an interesting question, I'm trying to get a feeling for how the SFI is affected by the SN value.
It's not simple, if you take a large area sunspot group such as the one (I forget the sequence number) that was very complex on the last rotation then on its return this rotation the area of the spots is smaller due to the gradual decay that's expected, which should mean lower flux from that area but by dividing it into 5 smaller regions the flux contribution doesn't change but SN increases for a given number of actual umbrae.
Yes, the changes as the spot moves across the visible face of the sun have an effect, but at some point that single spot group was renumbered into 5 groups apparently because of changes in the magnetic structure. There was also one new group that appeared in what had been a blank region.
It suggests to me that the use of SN to track activity in terms of solar maximum etc is a little disconnected from the actual SFI which is the true measure of total activity. Or is it?
Whatever I think the sun always seems ready to defy explanation.
|
|
|
|
Post by missouriboy on Apr 25, 2024 2:32:54 GMT
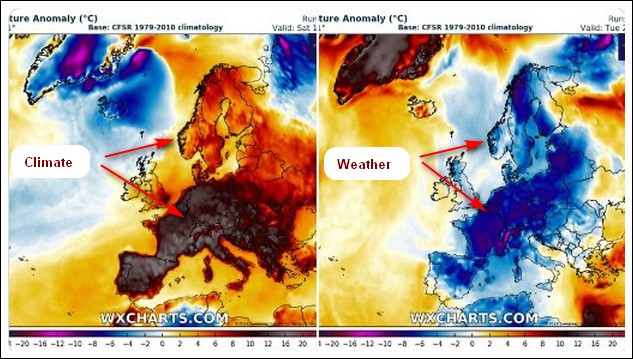
And now in Europe,
Europe’s historic temperature shift, from summer to winter in just one day
|
|
|
|
Post by ratty on Apr 25, 2024 10:03:52 GMT
And now in Europe, Europe’s historic temperature shift, from summer to winter in just one day  |
|
|
|
Post by gridley on Apr 25, 2024 13:38:42 GMT
And now in Europe, Europe’s historic temperature shift, from summer to winter in just one day  Actually they will say it is climate - surely you've heard the "climate change causes an increase in severe weather events" mantra? |
|
|
|
Post by acidohm on Apr 27, 2024 12:53:42 GMT
Well that was wild! The sun exploded into new relms of activity for this cycle mostly due to an area associated with 3638. The graph below from the Solen page has 7 day increments on the x axis. The sun takes 27 days to rotate 260 degrees which is 13½ for earthside so the 7 days roughly lines up. The peaks and troughs also roughly line up in 14 day periods which means the active area that was present in the past week has been consistently active and the opposite side inactive since October last year. It would be much easier to note this if the sun had geographical features! Which of course it doesn't. It does mean, however, that we can expect a 2 week period of reduced activity until the active face returns. Or so the theory goes.  |
|
|
|
Post by missouriboy on Apr 27, 2024 14:53:33 GMT
So. Does this do anything to the one-peak forecast for SC25?
|
|
|
|
Post by acidohm on Apr 27, 2024 15:45:28 GMT
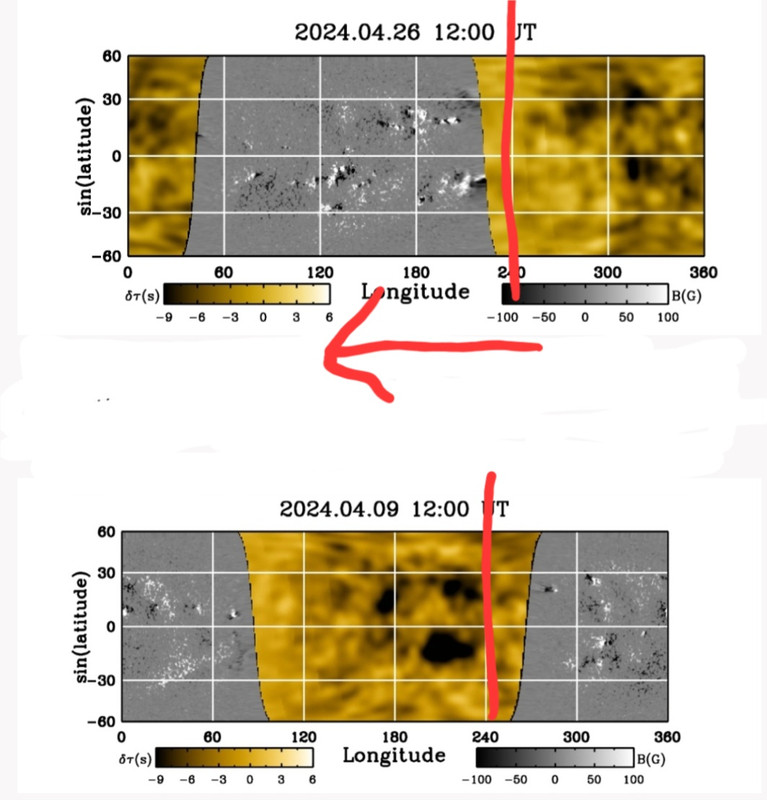
So. Does this do anything to the one-peak forecast for SC25? Ah! Indeed....but I think no more then a 0 sunspot day at solar max does the opposite? The smoothed average is currently quite a bit below the July 23 peak, its what happens next that will decide but as I said, I don't expect there to be such elevated activity for about 2 weeks. Perhaps it'll be much reduced...all we got these days is this for farside..  For comparison, recent activity showed as this prior to rotating to view  However bear in mind, many spots formed in this area while in view...like alot! 3638-3659 all numbered at one time! Something I guess around 15-20 spots grew from nothing while facing us. Initially as what became 3638 rotated to view, it was assumed that the old spot had decayed whereas the activity had migrated east out of initial sight. Very dynamic period. But yes, in itself not a cycle peak maker, but interesting to see and very keen to see what happens next! |
|
|
|
Post by acidohm on Apr 27, 2024 15:51:24 GMT
In fact you can see the eastward migration comparing the longitudinal lines, active area shows close to 240 farside but appears, and develops further east earthside. Angular momentum showing??  BTW, I may be teaching to suck eggs, but east and west for the sun are designated from earth's perspective, not the sun so they seems back to front considering the solar rotation. |
|
|
|
Post by acidohm on Apr 27, 2024 16:07:16 GMT
There's so much on the solen page....here a 365 day smoothed graph I paid no attention to before. This is what prolonged increase in activity will have to alter the shape of to create another peak. You can see the 2nd peak of 24 there, a very very pronounced event. Bear in mind it was october 22 i confidently pronounced with no qualification to do so that cycle 25 would single peak around march/april 23 🤔  |
|
|
|
Post by missouriboy on Apr 27, 2024 17:00:34 GMT
Great work. That chart extended back to the start of SC24 would be useful.  |
|
|
|
Post by acidohm on Apr 27, 2024 17:45:09 GMT
Great work. That chart extended back to the start of SC24 would be useful.  I contacted the person who seems to run the page today, if they are amiable I might ask.... |
|
|
|
Post by acidohm on Apr 28, 2024 21:01:51 GMT
This guy states some interesting stuff relating to solar cycles
|
|
|
|
Post by missouriboy on Apr 28, 2024 21:53:13 GMT
He gave a deferencial nod to Geomagnetic Disorder Syndrome.  |
|