|
|
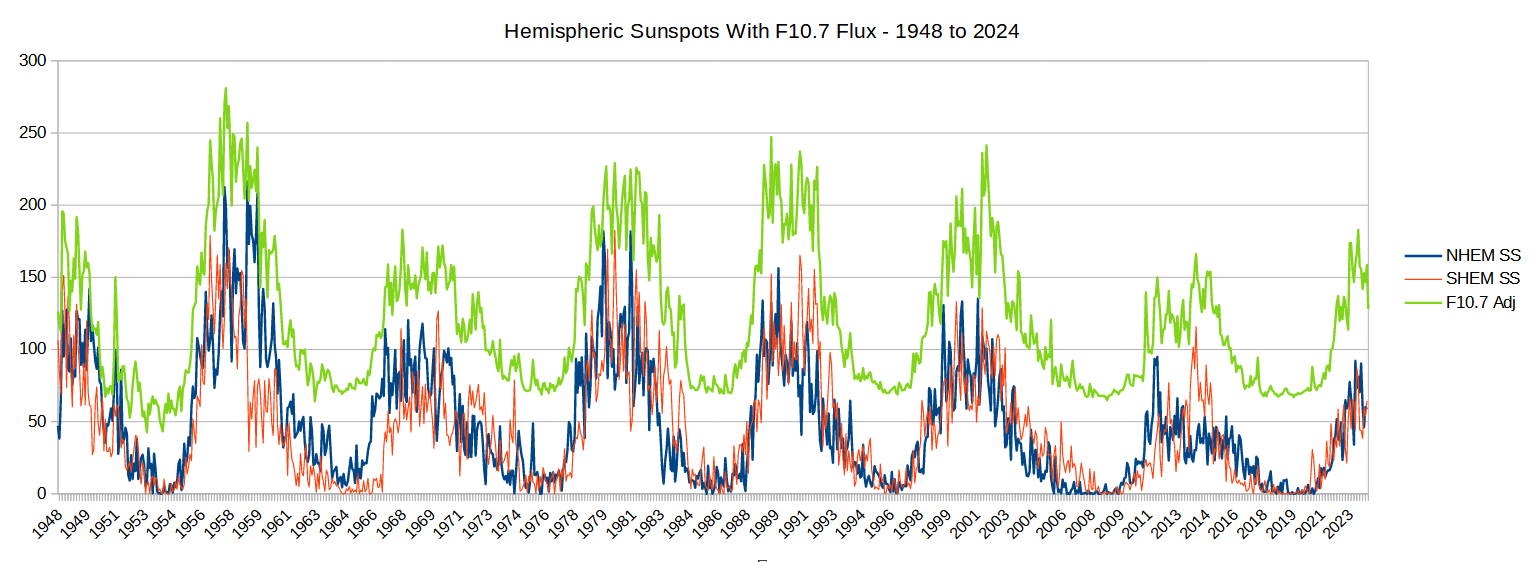
Post by acidohm on Mar 5, 2024 5:28:49 GMT
Hemisphere and total SSN updated to March.  |
|
|
|
Post by ratty on Mar 5, 2024 6:30:27 GMT
Hemisphere and total SSN updated to March.  Acid, where can we see the full chart and a legend? |
|
|
|
Post by acidohm on Mar 5, 2024 17:25:05 GMT
|
|
|
|
Post by ratty on Mar 5, 2024 22:28:47 GMT
Thanks Acid. Now, some commentary from spot watchers? (I'm a wriggle watcher.)  |
|
|
|
Post by nonentropic on Mar 6, 2024 0:33:53 GMT
You can't argue that the NH and SH are synchronized yet but each week will bring some clarity.
If they are, cycle 25 will in essence be a small cycle. Exciting!
|
|
|
|
Post by acidohm on Mar 6, 2024 5:34:04 GMT
Thanks Acid. Now, some commentary from spot watchers? (I'm a wriggle watcher.)  Undoubtedly 25 current peak is higher then 24. 25 was predicted to peak in 2025. Regarding overall strength, the dissimilarity in 24s peak came predominantly from the activity in the later Nh peak. 25s current peak was a result of both hemisphere being broadly equally active. I wonder if a simple equation along the lines of total cycle sunspot amount/time might produce different cycle strength values to peak ssn in a meaningful way? |
|
|
|
Post by nonentropic on Mar 6, 2024 6:19:50 GMT
It would
|
|
|
|
Post by missouriboy on Mar 6, 2024 14:47:11 GMT
Thanks Acid. Now, some commentary from spot watchers? (I'm a wriggle watcher.)  Undoubtedly 25 current peak is higher then 24. 25 was predicted to peak in 2025. Regarding overall strength, the dissimilarity in 24s peak came predominantly from the activity in the later Nh peak. 25s current peak was a result of both hemisphere being broadly equally active. I wonder if a simple equation along the lines of total cycle sunspot amount/time might produce different cycle strength values to peak ssn in a meaningful way? Do I see a new, tested equation in your future?  |
|
|
|
Post by nonentropic on Mar 6, 2024 17:53:58 GMT
Beyond my pay grade but a graph showing the addition of the NH and SH respecting sign would show the asynchronicity of the cycles.
the cycle size is more about aggregate than moment in time peak.
|
|
|
|
Post by duwayne on Mar 6, 2024 18:01:48 GMT
Thanks Acid. Now, some commentary from spot watchers? (I'm a wriggle watcher.)  Undoubtedly 25 current peak is higher then 24. 25 was predicted to peak in 2025. Regarding overall strength, the dissimilarity in 24s peak came predominantly from the activity in the later Nh peak. 25s current peak was a result of both hemisphere being broadly equally active. I wonder if a simple equation along the lines of total cycle sunspot amount/time might produce different cycle strength values to peak ssn in a meaningful way? That's a good question. There obviously would be a difference. My presumption is it's been looked at previously and the difference is small. I've noted here before that I read that the 13-year smoothing period was chosen because it is a time period which gives a good correlation between the sunspot number maximum and the 10.7 CM Solar Radio Flux maximums. |
|
|
|
Post by missouriboy on Mar 7, 2024 23:05:01 GMT
Don't know if this helps. But here is a visual.  |
|
|
|
Post by ratty on Mar 7, 2024 23:28:05 GMT
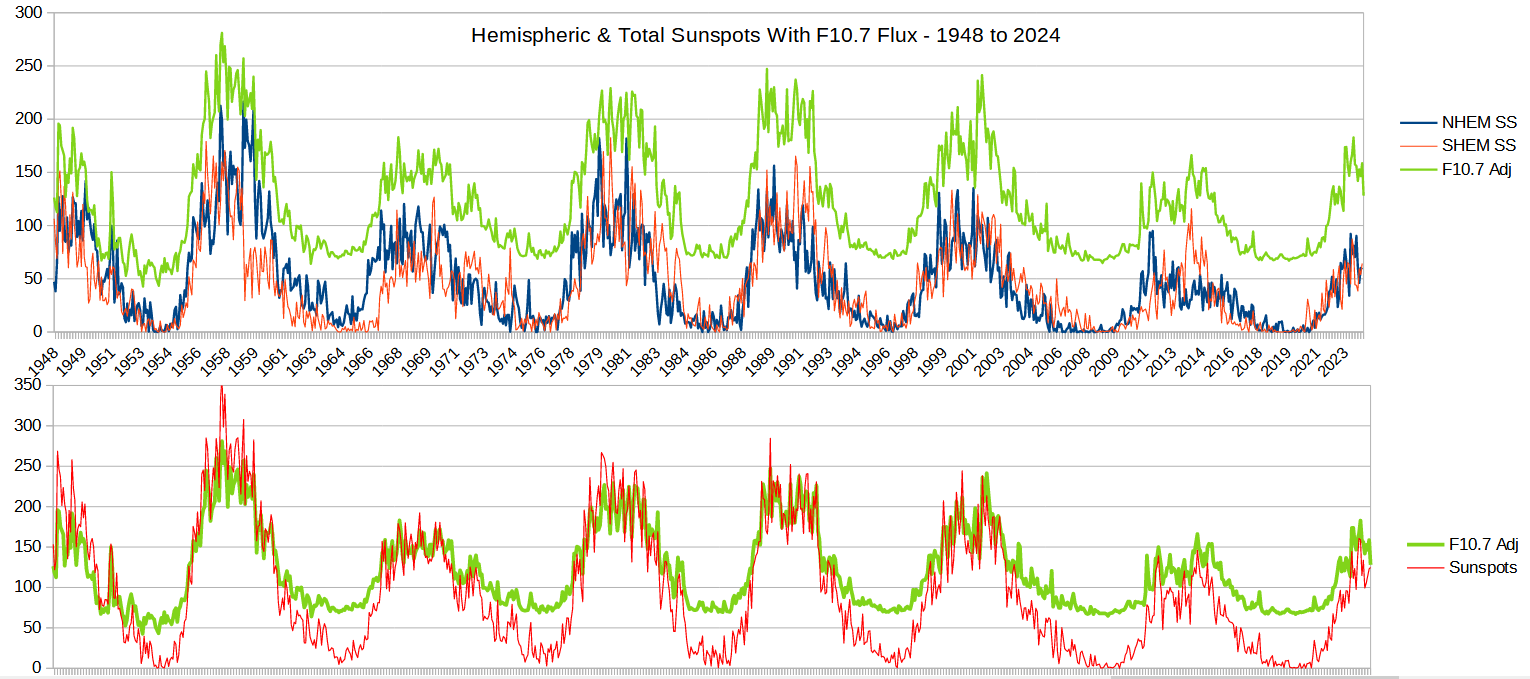
Don't know if this helps. But here is a visual.  What does that chart look like when you remove the individual NH & SH numbers and plot the total of both? |
|
|
|
Post by missouriboy on Mar 8, 2024 13:56:49 GMT
Don't know if this helps. But here is a visual. What does that chart look like when you remove the individual NH & SH numbers and plot the total of both? Just for you Ratty. Both in one chart.
 |
|
|
|
Post by Sigurdur on Mar 20, 2024 0:02:02 GMT
www.spaceweather.com/POTENTIALLY DANGEROUS SUNSPOT: New sunspot AR3615 is complicated. It looks more like a rash than a sunspot, with a dozen-plus dark cores scattered randomly over a wide area. A magnetic map of the region shows why it is potentially dangerous:
|
|
|
|
Post by acidohm on Mar 24, 2024 7:45:36 GMT
|
|