|
|
Post by duwayne on Oct 3, 2022 13:48:36 GMT
I can wait as well. But as per request ...
I had thought that Dr Lief's published high value for SC24 was 128. I only get 116.
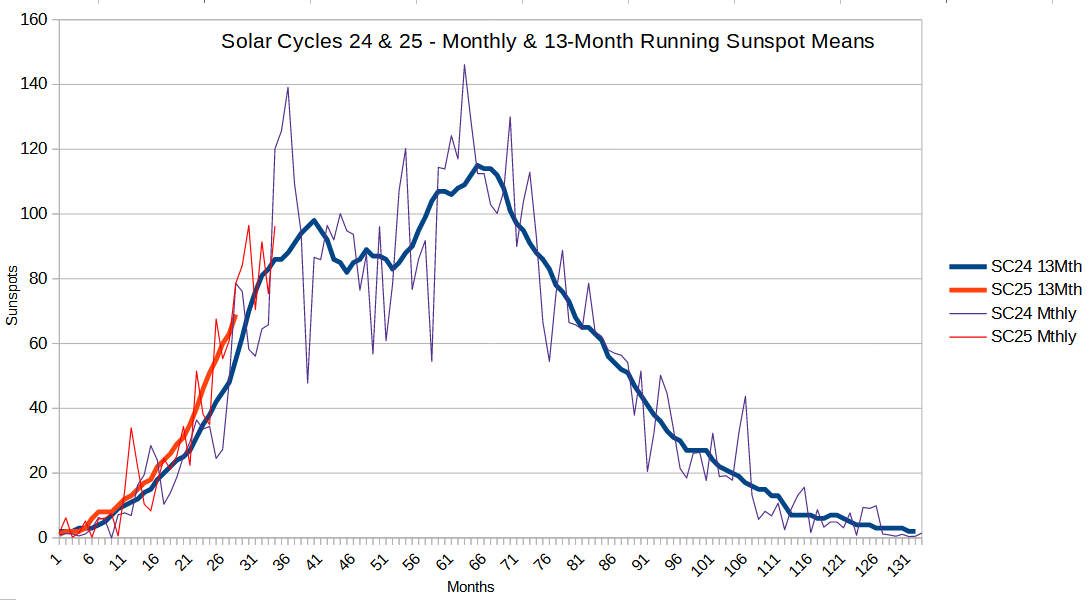
 Thanks. 128 plus or minus 10 is Svaalgard's predicted value for Cycle 25. I was hoping to see both the smoothed values and the monthly actuals on the same chart. I'd put the smoothed values as a heavy line since they are indicative of the real underlying trend. |
|
|
|
Post by blustnmtn on Oct 3, 2022 16:24:22 GMT
|
|
|
|
Post by missouriboy on Oct 3, 2022 22:08:35 GMT
It's now a 13-Month centered moving average.
 |
|
|
|
Post by duwayne on Oct 4, 2022 2:45:24 GMT
I like the top one. The 13 month curve needs to be backed up by 6 months to get a direct comparison. The last SC25 data point, for example, is for March, not September. Then you get an A+ for information display. I haven't seen this chart displayed before. There are various versions of the smoothed data and monthly data but always shown separately. |
|
|
|
Post by code on Oct 4, 2022 3:06:13 GMT
I can wait as well. But as per request ...
I had thought that Dr Lief's published high value for SC24 was 128. I only get 116.
Thanks. 128 plus or minus 10 is Svaalgard's predicted value for Cycle 25. I was hoping to see both the smoothed values and the monthly actuals on the same chart. I'd put the smoothed values as a heavy line since they are indicative of the real underlying trend. We can ask him, he is on this board. |
|
|
|
Post by missouriboy on Oct 4, 2022 12:38:44 GMT
It's now a 13-Month centered moving average.
|
|
|
|
Post by blustnmtn on Oct 4, 2022 13:12:45 GMT
It's now a 13-Month centered moving average.
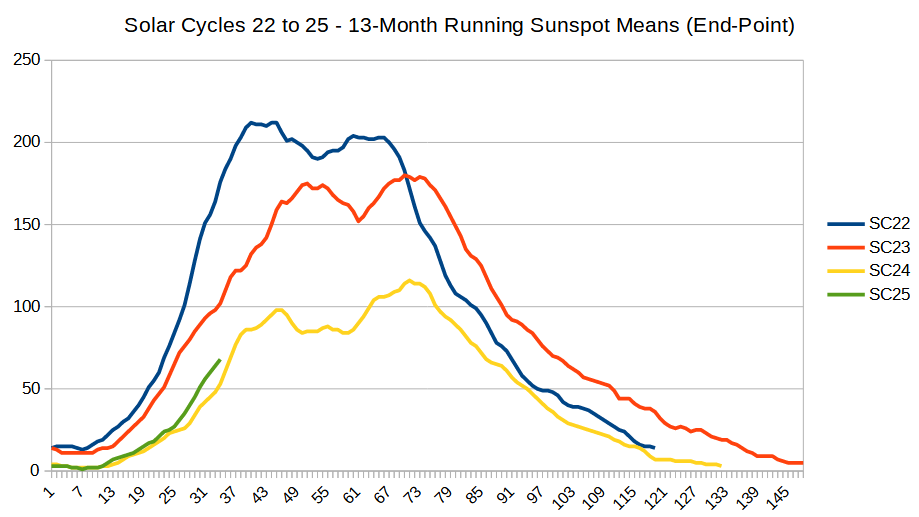
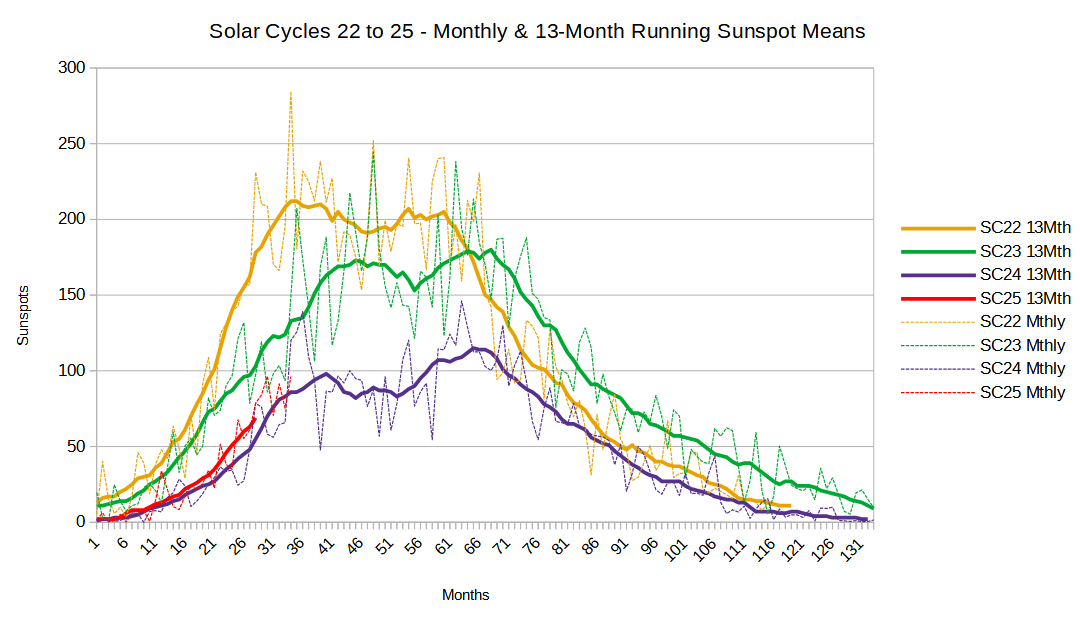
It would be interesting at some point to just see 25’s progress compared to 24 and 20. Lief specifically places 25 between those 2 cycles in strength. Seems like it’s following that course so far. |
|
|
|
Post by blustnmtn on Oct 4, 2022 15:15:05 GMT
|
|
|
|
Post by duwayne on Oct 4, 2022 15:31:36 GMT
It's now a 13-Month centered moving average.
Missouri, the chart is awesome. If you would change the x-axis label from "Months" to "Months since beginning of Solar Cycle" or something similar in response to Ratty's question, I think you'd have the best chart on the internet and the most up tp ate for following the progress of Solar Cycle 25. |
|
|
|
Post by missouriboy on Oct 4, 2022 17:43:54 GMT
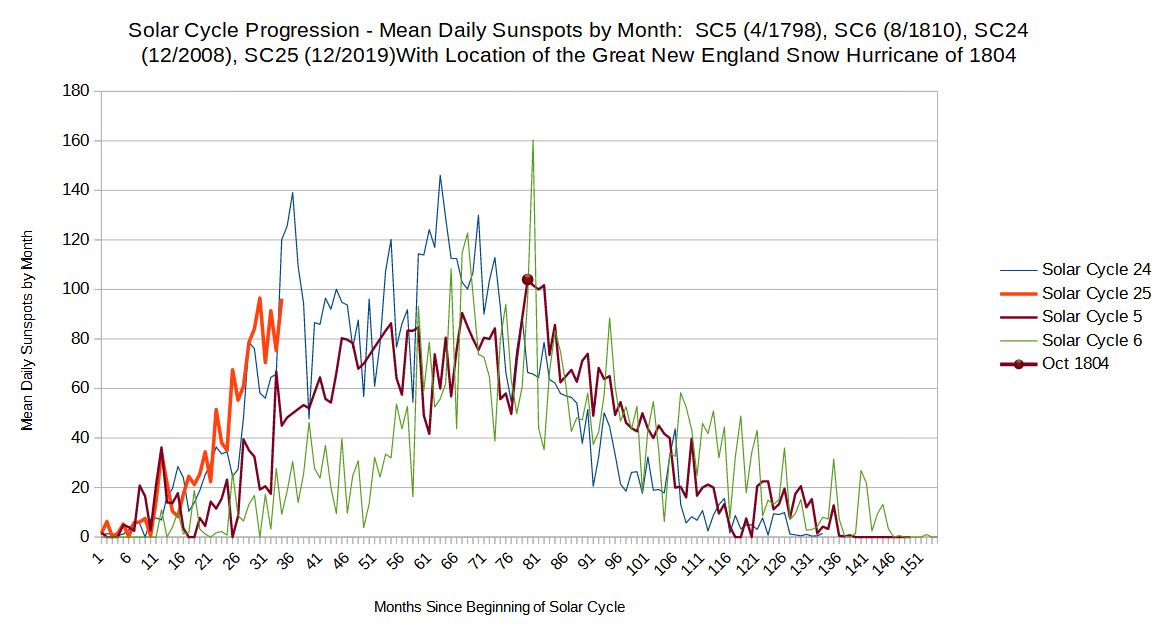
Another option on the solen site is comparison with other historically low activity cycles... 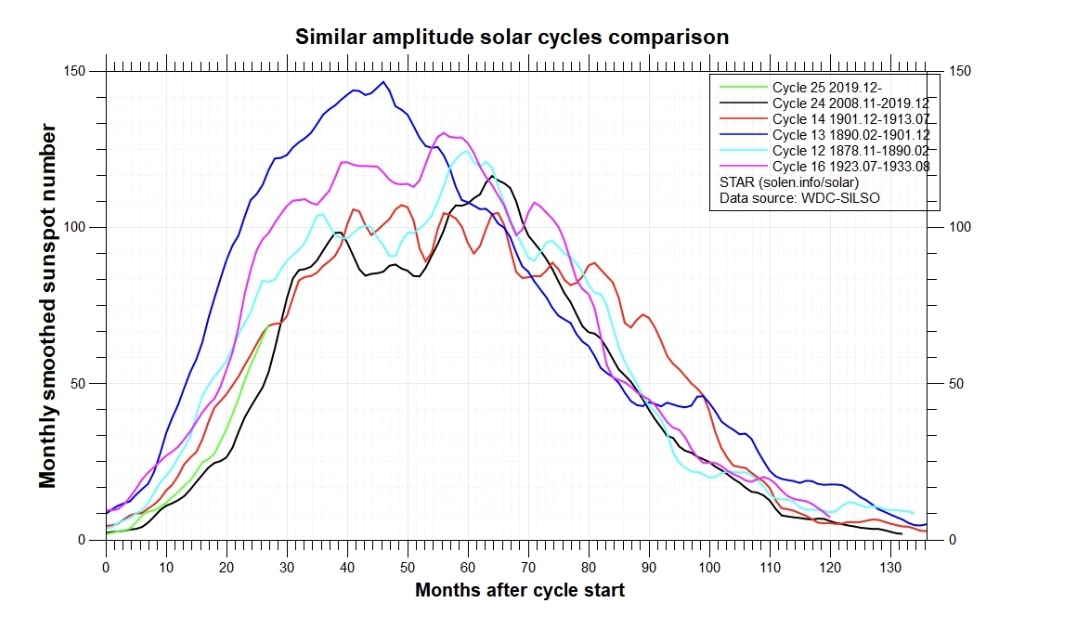 Thanks Acid. That is an excellent chart. I may have to upgrade my graphics software. Likely $$ for a top-notch package. Harvard Graphics was considered top-of-the-line years ago. They could add the Dalton Minimum. This is only monthly for now. Just remembered (was reminded) that Hurricane Sandy (Oct. 2012) occurred at the same point in the solar cycle as we are now. The great Snow Hurricane of 1804 was on the backside of the cycle, but sunspot activity spiked.
On Oct. 9, 1804, a snow hurricane struck Eastern New England, the first time in recorded history a tropical storm produced snowfall.
The storm devastated shipping, froze potatoes, destroyed orchards, crushed houses, killed dozens of people, leveled timber lots, smashed wharves and took the steeple off the Old North Church in Boston.
Not until 1841 would another tropical storm produce snow, and then not again until Hurricane Ginny struck in 1963. And then in 2012, Hurricane Sandy struck, another rare snow hurricane.
 |
|
|
|
Post by acidohm on Oct 4, 2022 18:29:55 GMT
Another option on the solen site is comparison with other historically low activity cycles... Thanks Acid. That is an excellent chart. I may have to upgrade my graphics software. Likely $$ for a top-notch package. Harvard Graphics was considered top-of-the-line years ago. They could add the Dalton Minimum. This is only monthly for now. Just remembered (was reminded) that Hurricane Sandy (Oct. 2012) occurred at the same point in the solar cycle as we are now. The great Snow Hurricane of 1804 was on the backside of the cycle, but sunspot activity spiked.
On Oct. 9, 1804, a snow hurricane struck Eastern New England, the first time in recorded history a tropical storm produced snowfall.
The storm devastated shipping, froze potatoes, destroyed orchards, crushed houses, killed dozens of people, leveled timber lots, smashed wharves and took the steeple off the Old North Church in Boston.
Not until 1841 would another tropical storm produce snow, and then not again until Hurricane Ginny struck in 1963. And then in 2012, Hurricane Sandy struck, another rare snow hurricane.
I like the personal touch your graphing brings to us Mr.M! What would we do without you!? And i like your selection of cycles too....thinking a more fractured/indistinct peak similar to cycle 5....no science behind my thinking, its just where i was heading while observing recent trends. Most likely tho, as ive said, a peak within 6 months. |
|
|
|
Post by missouriboy on Oct 4, 2022 22:18:18 GMT
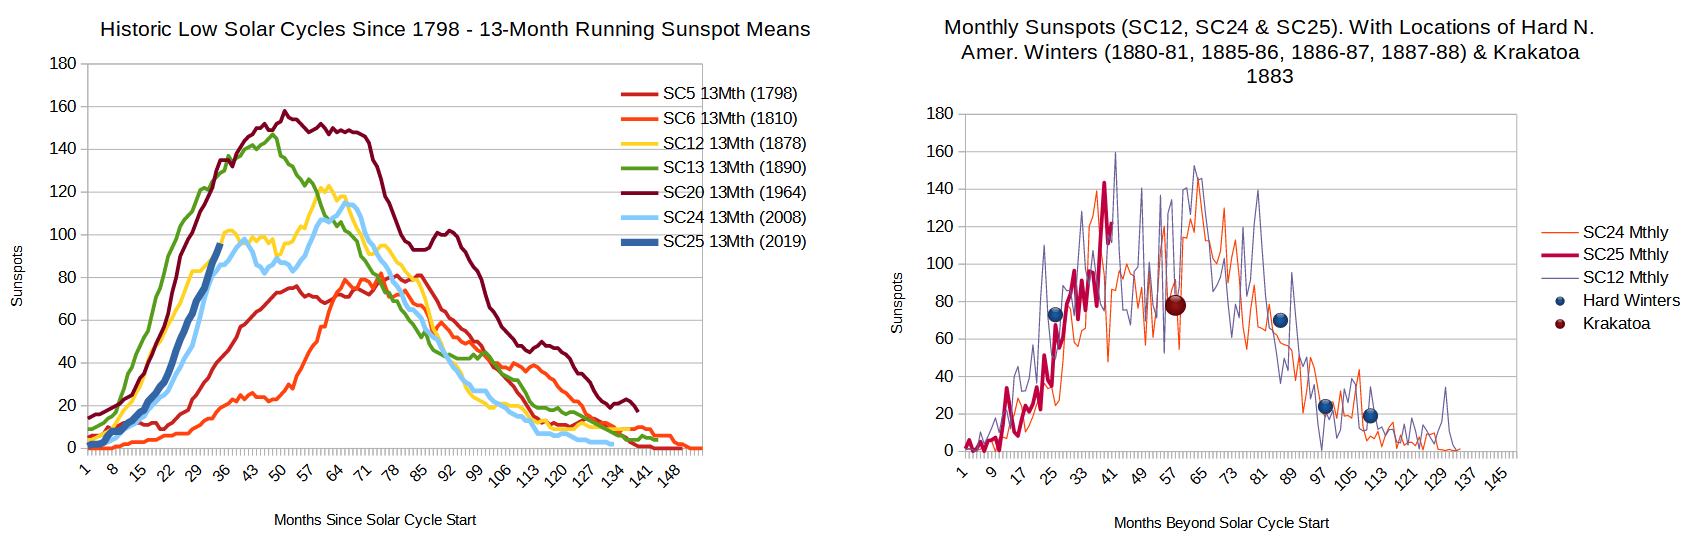
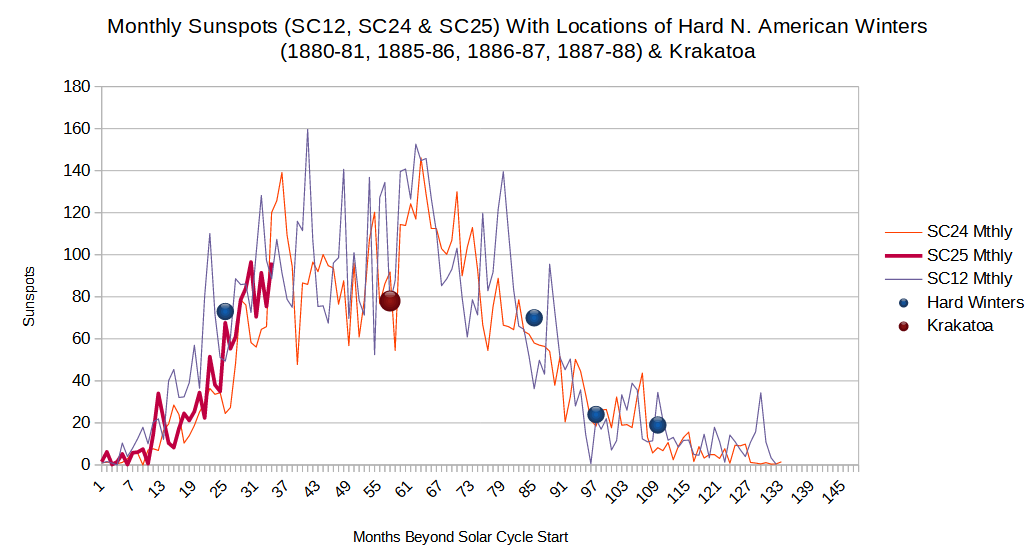
Since Solen left out the Dalton Minimum, I've included SC5 & 6 in a new chart. Chart legend notes Solar Cycle start year. Low solar cycle 12 looks Very close to a mirror image of SC24. In comparison, SC20 (that triggered ice age alarms) doesn't look so low. Chart 2 shows the location of historic SC12 winters over-plotted on monthly sunspots for cycles 12, 24 and 25. While history may never "exactly" repeat itself ... e.g. ocean is warmer now ... it could rhyme. Rhyming in a winter of gas shortages in Europe could be a disaster. Old Farmers prediction for the Midwest is not encouraging.
  |
|
|
|
Post by blustnmtn on Oct 4, 2022 23:16:56 GMT
Certainly looks like 25 is a lot closer to 24 than 20. But whatever, Lief seems to be correct.
|
|
|
|
Post by nonentropic on Oct 5, 2022 2:43:38 GMT
|
|
|
|
Post by missouriboy on Oct 5, 2022 13:41:21 GMT
Weather, repeated often enough, becomes climate.
|
|