|
|
Post by blustnmtn on Oct 1, 2022 15:10:20 GMT
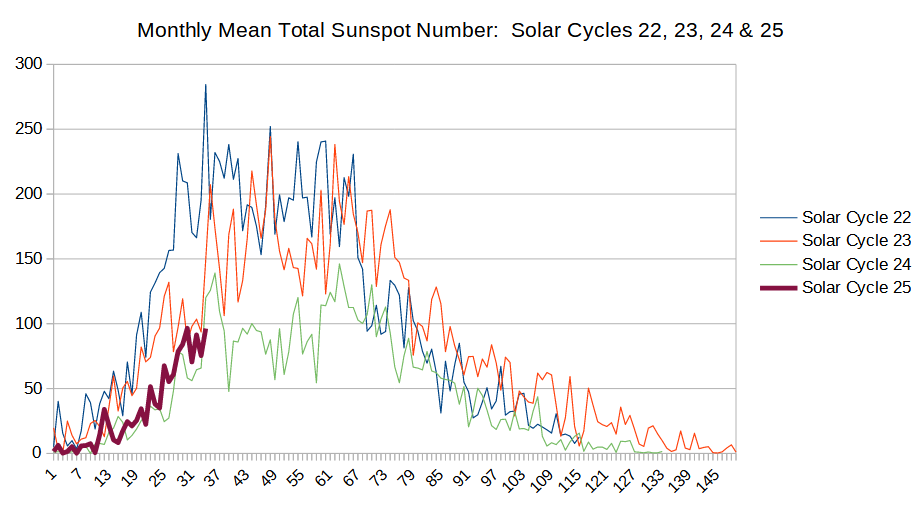
SC25 is not immediately repeating the large monthly sunspot spike that seems to normally(?) occur around this time in the cycle. SC25 is hanging below SC24 at this point. Heading into this winter, w will see if SC25 steps up or not. That record high cycle called for by some forecasters seems to have evaporated.  Svalgaard is not surprised. |
|
|
|
Post by nonentropic on Oct 1, 2022 17:45:24 GMT
MB like your early call, below 24 still possible but most certainly not in the box. World temperatures?  |
|
|
|
Post by ratty on Oct 1, 2022 23:35:18 GMT
SC25 is not immediately repeating the large monthly sunspot spike that seems to normally(?) occur around this time in the cycle. SC25 is hanging below SC24 at this point. Heading into this winter, w will see if SC25 steps up or not. That record high cycle called for by some forecasters seems to have evaporated.  Svalgaard is not surprised. Missouri, would you make yourself a calendar entry to update your graph please? |
|
|
|
Post by acidohm on Oct 2, 2022 5:03:59 GMT
SC25 is not immediately repeating the large monthly sunspot spike that seems to normally(?) occur around this time in the cycle. SC25 is hanging below SC24 at this point. Heading into this winter, w will see if SC25 steps up or not. That record high cycle called for by some forecasters seems to have evaporated.  I gotta admit i hadnt noticed that spike as the smoothing on solen must be greater (90 days?). Interesting characteristic and im now eagerly observing to detect on this cycle! Of course if you look at cycle 23, almost a year elapsed from a 'false peak' to a large final uptick. We're currently at about 6 months from current high point, but a big uptick i guess could be due by march next year or so. If it happens, or how strong it is..... I do keep coming back to the idea of a sparkler whose activity, especially towards the end is inconsistent and may appear to die but will suddenly burst back breifly as the heat bridges to final untapped chemicals. My point is the solar activity appears to tap into energy which is obviously building as activity increases, its obviously a non conformative mass but somewhere theres a bulk which once surfaces get rapidly used up as a peak and after that its just using up whatever trails behind. I mean, this is the rotating plasma isnt it, going from pole to equator and back again hence the butterfly effect of sunspot diagrams. Then theres the out of sync nature of different velocities in N S hemispheres as observed by twin peaks..... Perhaps more like a mud bubble, splut 🤔😄 |
|
|
|
Post by acidohm on Oct 2, 2022 5:35:58 GMT
Had to brush up on this and this seems a good resource on understanding why a solar cycle exists...
Differential rotation of the gaseous solar body between the equator and poles causes distortion of the magnetic field which wants to maintain shortest route, fails as distortion increases (breaking magnetic field...sunspot), wins when relaxes back to stable state (no sunspots)
|
|
|
|
Post by missouriboy on Oct 2, 2022 14:22:07 GMT
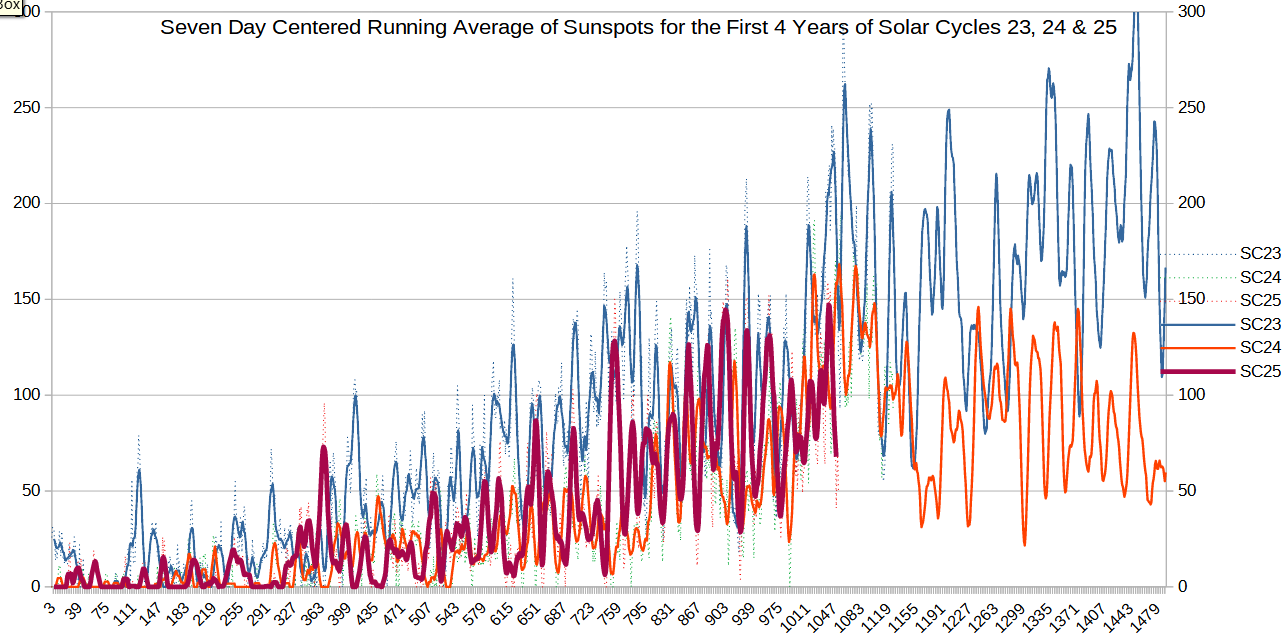
At some point one drops down into the weeds, but the 7-day moving average catches the small pulses. We need more indexes than sunspots. Guess I could go to flux.
 |
|
|
|
Post by walnut on Oct 2, 2022 14:38:08 GMT
At some point one drops down into the weeds, but the 7-day moving average catches the small pulses. We need more indexes than sunspots. Guess I could go to flux.
Yes |
|
|
|
Post by duwayne on Oct 2, 2022 17:46:48 GMT
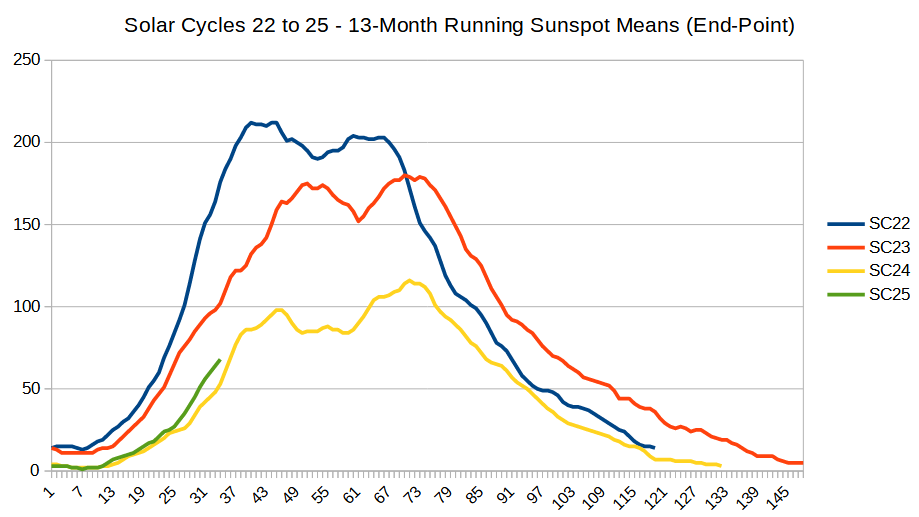
SC25 is not immediately repeating the large monthly sunspot spike that seems to normally(?) occur around this time in the cycle. SC25 is hanging below SC24 at this point. Heading into this winter, w will see if SC25 steps up or not. That record high cycle called for by some forecasters seems to have evaporated.  Missouri, would you consider adding the 13-month smoothed averages to your monthly chart? If you already have your data on an excel spreadsheet and are using the spreadsheet to draw the graph, it is pretty easy to do. You probably already know how to do the calculation, but, if not, you add half of last month's (September's) sunspot number to the previous 11 months plus 1/2 of September 2021's number and divide the total by 12. The result is the 13-month smoothed average for March 2022.
|
|
|
|
Post by nonentropic on Oct 2, 2022 18:07:56 GMT
As a wild suggestion we could just wait!
Cumulative also a candidate but start date is always tricky.
|
|
|
|
Post by missouriboy on Oct 2, 2022 23:46:06 GMT
I can wait as well. But as per request ...
I had thought that Dr Lief's published high value for SC24 was 128. I only get 116.
 |
|
|
|
Post by ratty on Oct 3, 2022 1:09:40 GMT
I can wait as well. But as per request ...
I had thought that Dr Lief's published high value for SC24 was 128. I only get 116.
 What are the numbers on the 'Y' axis? |
|
|
|
Post by nonentropic on Oct 3, 2022 1:43:05 GMT
months
|
|
|
|
Post by acidohm on Oct 3, 2022 5:02:30 GMT
Surely X axis is months?
Y axis is sunspot no.
|
|
|
|
Post by acidohm on Oct 3, 2022 5:05:28 GMT
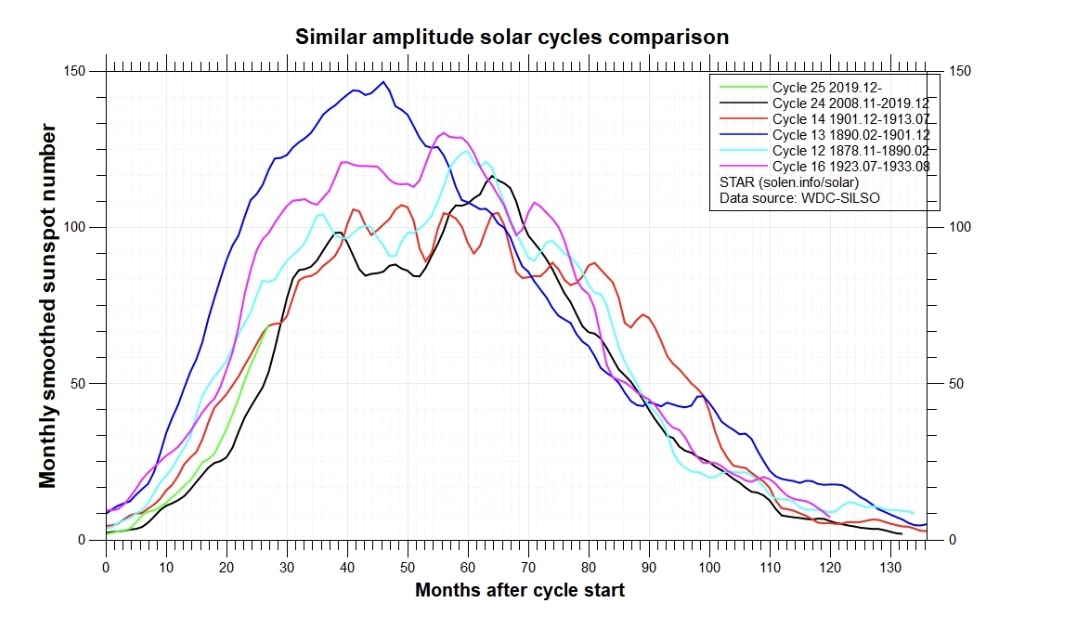
Another option on the solen site is comparison with other historically low activity cycles...  |
|
|
|
Post by ratty on Oct 3, 2022 5:18:43 GMT
Surely X axis is months? Y axis is sunspot no. I meant 'X' .... sigh.  |
|