|
|
Post by missouriboy on Aug 7, 2021 6:59:12 GMT
|
|
|
|
Post by flearider on Aug 7, 2021 19:35:19 GMT
YEAH NOTHING TO DO WITH ALL THE FRESH WATER MELT .. but we live in interesting times .. don't think it will go this time .. as it's getting colder yr on yr .. will soon be freeze time .. which according to astro will be early this yr ..
|
|
|
|
Post by acidohm on Aug 7, 2021 21:04:27 GMT
They're just arranging their excuses..... |
|
|
|
Post by missouriboy on Aug 7, 2021 21:41:37 GMT
They don't need no stinking excuses. They'll just make something else up. And the brain dead hallaluyah chorus will sing right on till the end. Good lemmings one and all.
|
|
|
|
Post by acidohm on Sept 12, 2021 14:26:39 GMT
This guy highlights a genuine change in the Atlantic from the past few years.
The cold blob has to some degree been persistent for years but has recently subsided.
|
|
|
|
Post by missouriboy on Sept 12, 2021 15:13:21 GMT
If there are no other logical candidates, should we start thinking geo-thermal? Iceland has been very active.
|
|
|
|
Post by blustnmtn on Sept 12, 2021 22:51:48 GMT
Regional imprints of changes in the Atlantic Meridional Overturning Circulation in the eddy-rich ocean model: os.copernicus.org/articles/17/1177/2021/Very long paper and it is focused on model accuracy. However, it has a great deal of information. |
|
|
|
Post by acidohm on Sept 17, 2021 16:18:13 GMT
RAPID have updated to March 2020 and made a graph. You can clearly see the downturn as purported by the media recently (not really!)  |
|
|
|
Post by Sigurdur on Sept 18, 2021 1:34:37 GMT
I must need new glasses.
|
|
|
|
Post by missouriboy on Feb 11, 2022 18:52:57 GMT
Temperature anomalies for both the North Atlantic (45-65N) and Central Atlantic (25-45N) have been drifting downward in these charts over the last 3 months ... about -0.3C. Longer if my memory serves. I have not kept the database, and do not find them in a database timeseries. Data for the Gulf Stream transects seems to be stuck at August 2020. So the cold blob lies undocumented for the last year and a half. Must be a good reason yah? The North Branch declined by 0.6C from 2008-16 ... then increased by about 0.2C to 2020. No news published since. 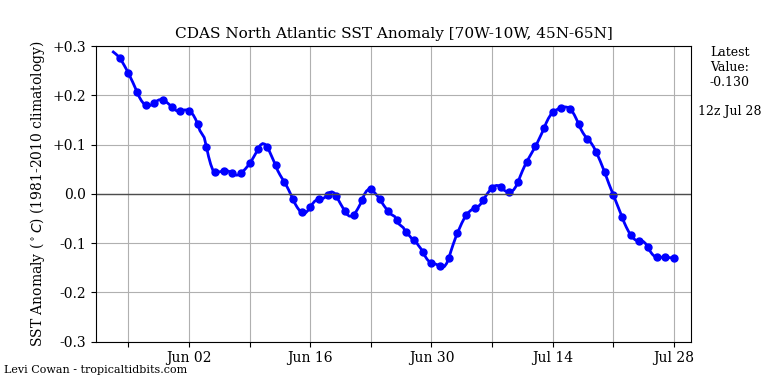 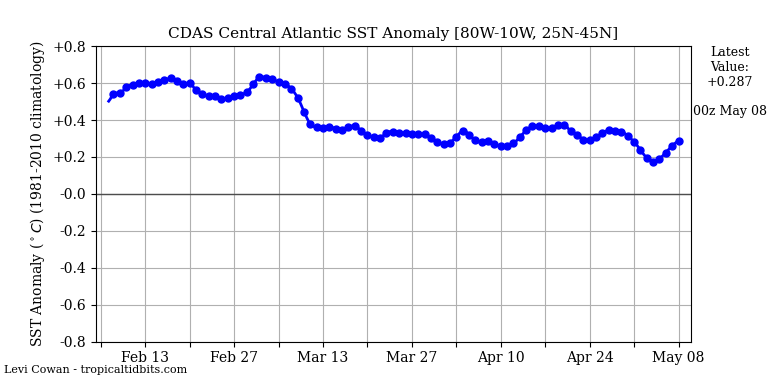 |
|
|
|
Post by Sigurdur on Feb 19, 2022 16:21:58 GMT
|
|
|
|
Post by blustnmtn on Feb 19, 2022 16:53:12 GMT
This actual examination of the actual AMOC as opposed to just excepting the dire model predictions has got to stop🤓 |
|
|
|
Post by missouriboy on Feb 19, 2022 18:18:19 GMT
The interesting part?
At 30°S, an increase of southward freshwater overturning transport has been estimated over the three decades, indicating that the AMOC is possibly in a bistable state based on findings from model studies. These negative values appear when AMOC exports freshwater out of the Atlantic, equivalent to a net precipitation over the Atlantic basin. In this case, the AMOC has multiple equilibria and may collapse due to a large enough freshwater perturbation (Dijkstra, 2007; Mecking et al., 2016; Weijer et al., 2019).
|
|
|
|
Post by missouriboy on Feb 25, 2022 17:46:26 GMT
The SST anomaly for the North Atlantic (45-65N) is heading towards a -0.6C decline over a period of 1 month. Cimate4you chart at bottom shows a similar drop in winter 2014-15, from which temps at 59N did not totally recover. No data since August 2020. Are we seeing another step decline? And, if so, what is the source/cause? Beaufort gyre?
Temperature anomalies for both the North Atlantic (45-65N) and Central Atlantic (25-45N) have been drifting downward in these charts over the last 3 months ... about -0.3C. Longer if my memory serves. I have not kept the database, and do not find them in a database timeseries. Data for the Gulf Stream transects seems to be stuck at August 2020. So the cold blob lies undocumented for the last year and a half. Must be a good reason yah? The North Branch declined by 0.6C from 2008-16 ... then increased by about 0.2C to 2020. No news published since.  |
|
|
|
Post by flearider on Feb 26, 2022 6:03:31 GMT
The SST anomaly for the North Atlantic (45-65N) is heading towards a -0.6C decline over a period of 1 month. Cimate4you chart at bottom shows a similar drop in winter 2014-15, from which temps at 59N did not totally recover. No data since August 2020. Are we seeing another step decline? And, if so, what is the source/cause? Beaufort gyre?
Temperature anomalies for both the North Atlantic (45-65N) and Central Atlantic (25-45N) have been drifting downward in these charts over the last 3 months ... about -0.3C. Longer if my memory serves. I have not kept the database, and do not find them in a database timeseries. Data for the Gulf Stream transects seems to be stuck at August 2020. So the cold blob lies undocumented for the last year and a half. Must be a good reason yah? The North Branch declined by 0.6C from 2008-16 ... then increased by about 0.2C to 2020. No news published since. when the Beaufort gyre go's you will know about it .. imagine north west territory temps in texas ...  |
|