|
|
Post by missouriboy on May 4, 2022 16:39:37 GMT
I have the goat waiting in the freezer. The 2021 date looks like it will become 2022. The -0.25 C value is still doable. So do I eat the goat now? Or later? I think I'm closer than Michael Mann.  Keep the goat. Note that you can see the steps in the historical temperature series in the Nino Region 24-mth SSTAs. Typically region 1+2 defines the bottom of this series. The Great Climate Shift of 1976 ... note the step-up in the bottom of the pattern through ~1996 onset of SC23. Note the current decline lead by region 1+2, which is now at or below the 1976-1996 bottoms. Another year of colder water out of the south might return us to pre-1976 levels. 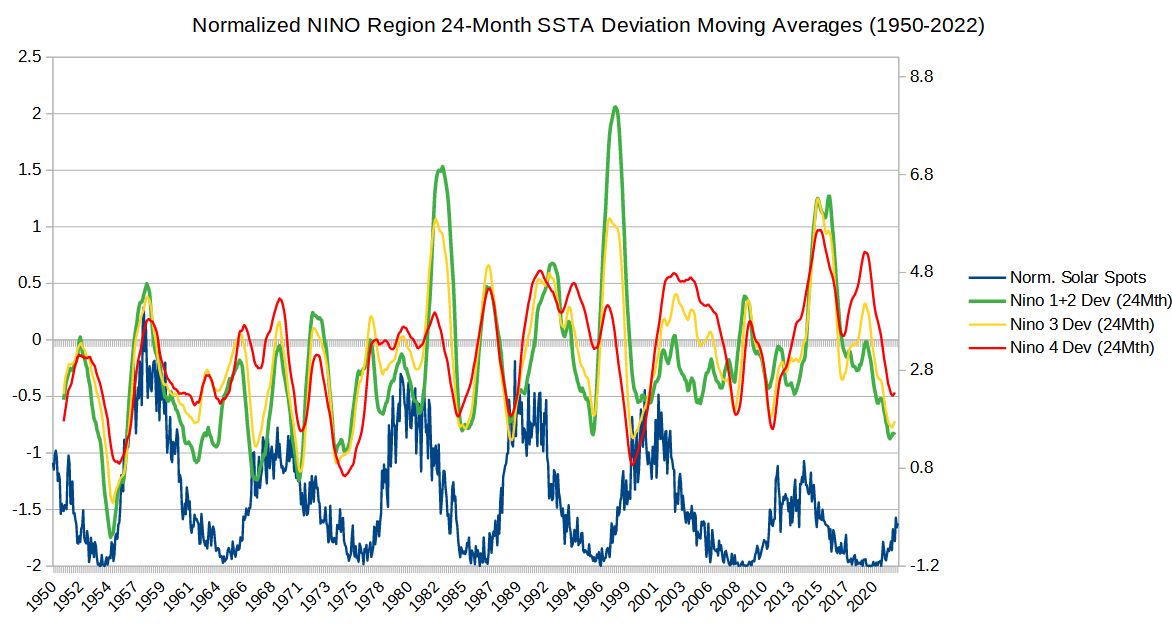 |
|
|
|
Post by Sigurdur on May 8, 2022 1:05:57 GMT
|
|
|
|
Post by ratty on May 8, 2022 1:39:05 GMT
Oh Mann, I came across a graph at 11m 39s that caused me some concern. 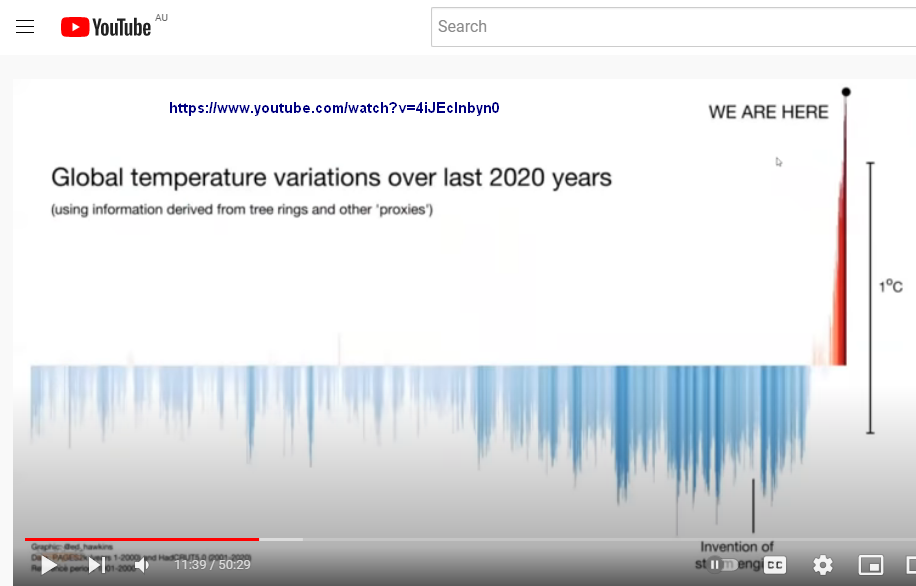 |
|
|
|
Post by Sigurdur on May 8, 2022 7:28:54 GMT
Oh Mann, I came across a graph at 11m 39s that caused me some concern. Later, when the observations completely blow the model apart, he doesn't slow down. The Humboldt current observations is cold, not hot as the model projects. |
|
|
|
Post by Sigurdur on Jul 31, 2022 1:49:38 GMT
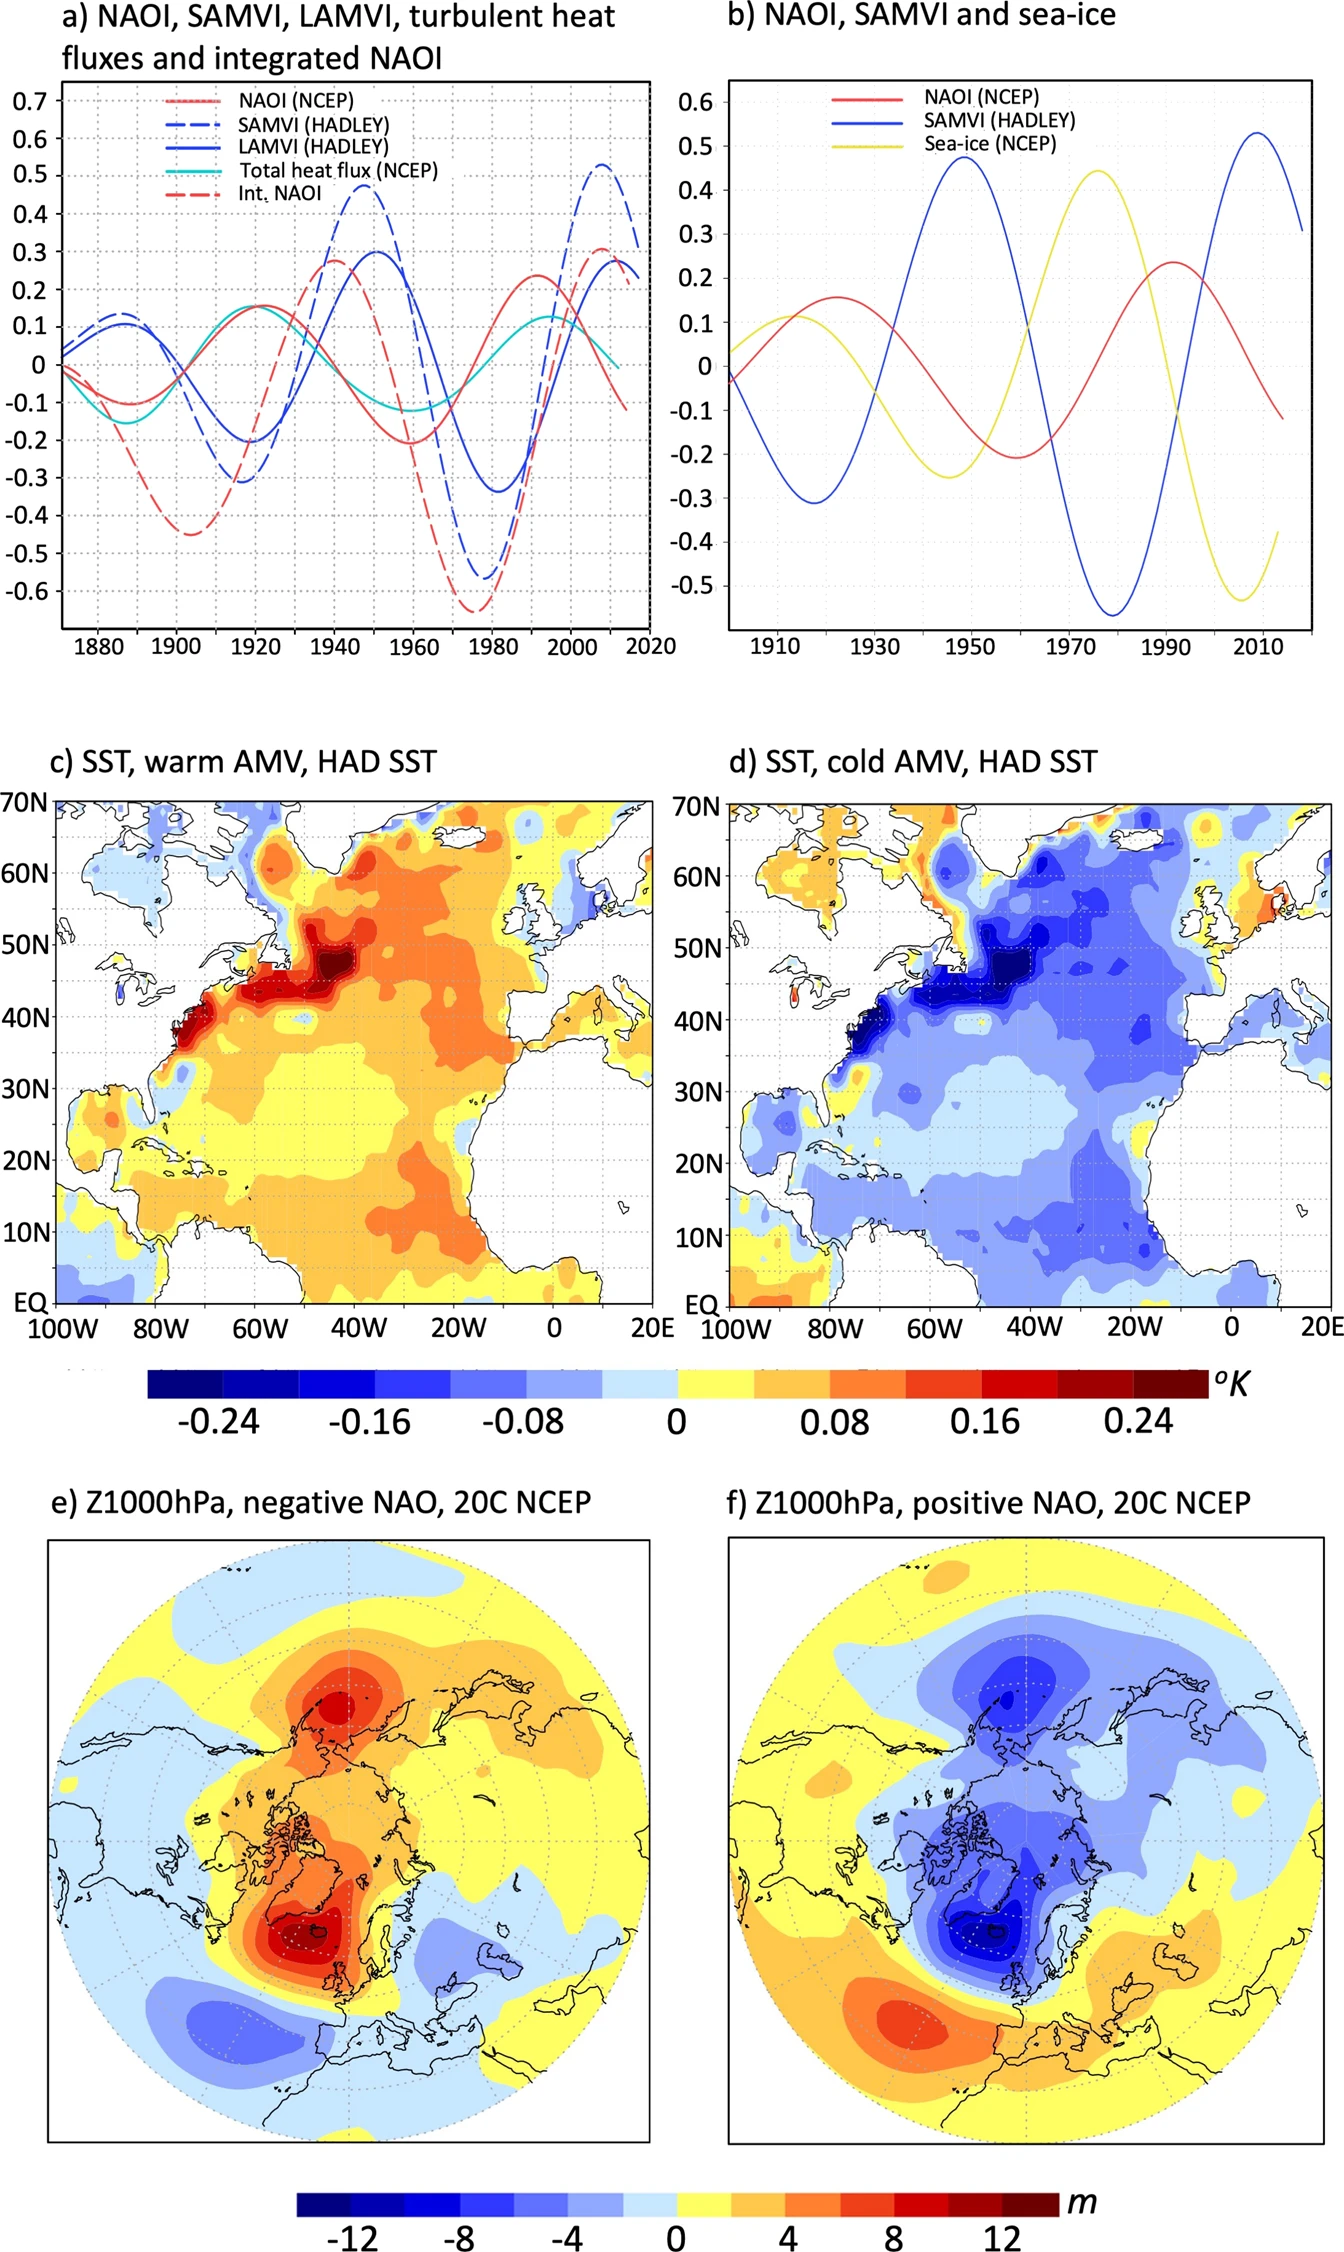
This coupled variability improves the performance of statistical models, which project further weakening of North Atlantic Oscillation, North Atlantic cooling and hiatus in wintertime North Atlantic-Arctic sea-ice and global surface temperature just like the 1950s–1970s. www.nature.com/articles/s41612-022-00275-1 |
|
|
|
Post by missouriboy on Jul 31, 2022 2:50:53 GMT
Oh Mann, I came across a graph at 11m 39s that caused me some concern. Later, when the observations completely blow the model apart, he doesn't slow down. The Humboldt current observations is cold, not hot as the model projects. He studied at the feet of Mann? And outdid his master. |
|
|
|
Post by missouriboy on Oct 2, 2022 18:46:21 GMT
Here is a RAPID data set update sent to me email.
|
|
|
|
Post by ratty on Oct 3, 2022 5:37:16 GMT
Here is a RAPID data set update sent to me email. This is disturbing .... |
|
|
|
Post by missouriboy on Oct 3, 2022 7:14:54 GMT
Here is a RAPID data set update sent to me email. This is disturbing .... Just the advertisements.  |
|
|
|
Post by missouriboy on Jan 26, 2023 3:29:23 GMT
Duwayne ... you will note the 60-year separation between waves. When you compare the NAO curves to solar cycles, the relationship is quite obvious ... strong cycles series = positive NAO ... weak cycles series = negative NAO. North Atlantic SST maps in the second tier show strong solar cycles series = positive NAO = warm North Atlantic and vice versa. My chart below those from the article are constructed from surface pressure data for Iceland, Gibraltar and the Azores. They replicate in detail the curves in the Article charts. Seems obvious (to me) that we are headed into another longer-term negative NAO period that will be colder than the one-cycle low of the 1960s. At best, we may get away with a two cycle low comparable to the 1880s and 90s. At worst it may look more like the Dalton Minimum. Slightly higher SSTs MAY modify the worst of those periods. When the AMO turns, the N Atlantic is going to get a lot colder. 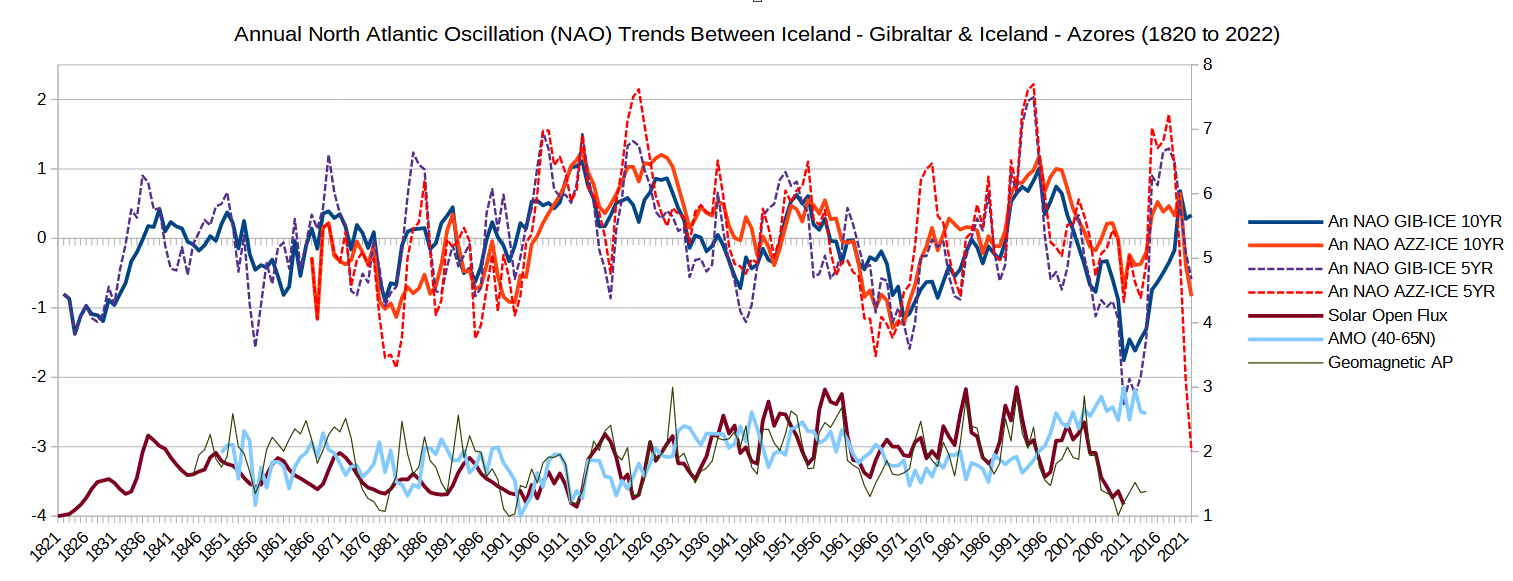 |
|
|
|
Post by duwayne on Jan 26, 2023 13:56:21 GMT
Duwayne ... you will note the 60-year separation between waves. When you compare the NAO curves to solar cycles, the relationship is quite obvious ... strong cycles series = positive NAO ... weak cycles series = negative NAO. North Atlantic SST maps in the second tier show strong solar cycles series = positive NAO = warm North Atlantic and vice versa. My chart below those from the article are constructed from surface pressure data for Iceland, Gibraltar and the Azores. They replicate in detail the curves in the Article charts. Seems obvious (to me) that we are headed into another longer-term negative NAO period that will be colder than the one-cycle low of the 1960s. At best, we may get away with a two cycle low comparable to the 1889s and 90s. At worst it may look more like the Dalton Minimum. Slightly higher SSTs MAY modify the worst of those periods. When the AMO turns, the N Atlantic is going to get a lot colder.
Why is the AMO running so warm? |
|
|
|
Post by missouriboy on Jan 26, 2023 15:57:44 GMT
Duwayne ... you will note the 60-year separation between waves. When you compare the NAO curves to solar cycles, the relationship is quite obvious ... strong cycles series = positive NAO ... weak cycles series = negative NAO. North Atlantic SST maps in the second tier show strong solar cycles series = positive NAO = warm North Atlantic and vice versa. My chart below those from the article are constructed from surface pressure data for Iceland, Gibraltar and the Azores. They replicate in detail the curves in the Article charts. Seems obvious (to me) that we are headed into another longer-term negative NAO period that will be colder than the one-cycle low of the 1960s. At best, we may get away with a two cycle low comparable to the 1889s and 90s. At worst it may look more like the Dalton Minimum. Slightly higher SSTs MAY modify the worst of those periods. When the AMO turns, the N Atlantic is going to get a lot colder.
Why is the AMO running so warm? That remains a mystery to me. |
|
|
|
Post by acidohm on Feb 16, 2023 17:33:50 GMT
|
|
|
|
Post by missouriboy on Feb 16, 2023 18:09:36 GMT
So we still ask ... what controls the flow speed? I note that 2016 was a strong El Nino year. |
|
|
|
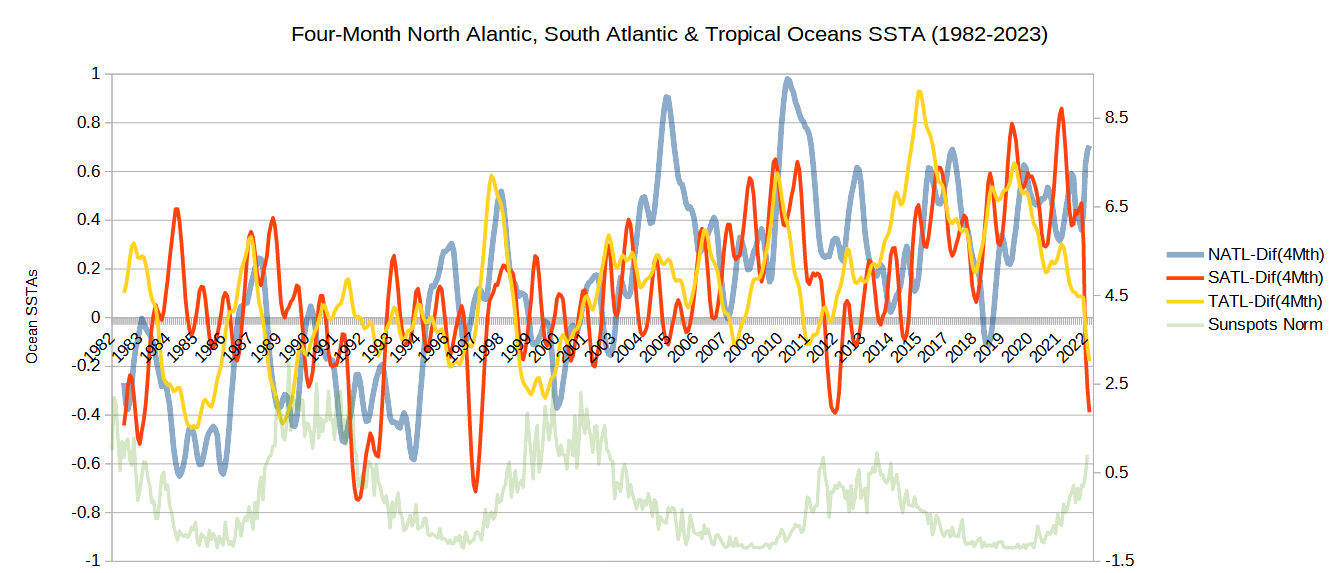
Post by missouriboy on Mar 1, 2023 16:23:27 GMT
Found this database on a Federal site. Supposedly the entire North, South and Tropical Atlantic. The positive AMO is still there. But look at the South Atlantic. Monster drop that mirrors what happened in 2012. Same location on the solar cycle. Analysis?
 |
|