|
|
Post by acidohm on Nov 14, 2021 9:12:09 GMT
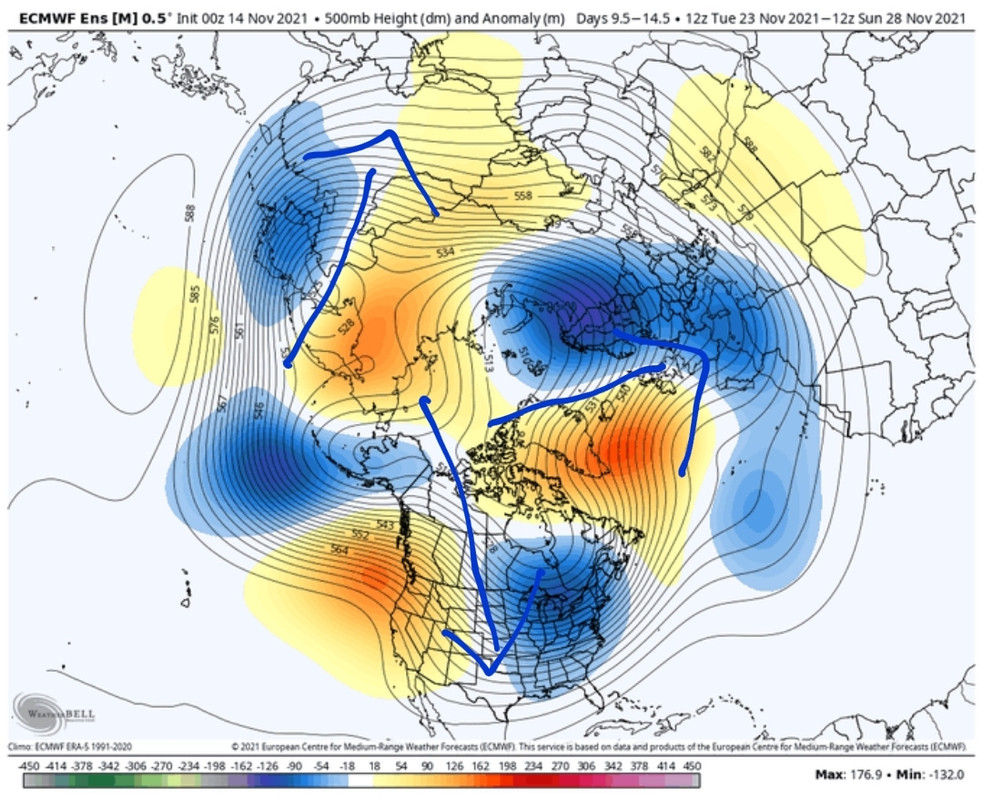
Poster of this graph described the tropospheric vortex as 'nuked' This is the European model output. Blue arrows denote movement of cold air....did I need to mention that 🤔  |
|
|
|
Post by douglavers on Nov 15, 2021 12:04:56 GMT
In sunny Melbourne, we have just enjoyed one of the coldest mid Nov days on record - about 13 degC.
We are about two weeks away from Summer.
20cms of snow in the mountains, and October and November are looking like some of the coldest and wettest on record.
I am going to have to resow some of my beans for the third time. Not impressed.
|
|
|
|
Post by Sigurdur on Nov 15, 2021 12:38:39 GMT
Is seed still plentiful?
|
|
|
|
Post by Sigurdur on Nov 15, 2021 14:28:55 GMT
|
|
|
|
Post by phydeaux2363 on Nov 15, 2021 14:30:59 GMT
Mr. Doug, has the Australian version of the MET office identified any particular pattern that is feeding the cool temperatures? Looks like the GFS sees high summer heat over most of the Continent next week.
|
|
|
|
Post by missouriboy on Nov 15, 2021 15:02:45 GMT
Poster of this graph described the tropospheric vortex as 'nuked' This is the European model output. Blue arrows denote movement of cold air....did I need to mention that 🤔 Would be interesting to have some statistics of "effects on the ground" at the base (and along the edges) of those arrows. Her, they have misjudged the western boundary of that blue mass for at least the next two days. It will fill back westward from Weds. forward.  |
|
|
|
Post by code on Nov 15, 2021 15:08:18 GMT
Some serious flooding, sure glad I left when I did as the Coq is now closed.
|
|
|
|
Post by missouriboy on Nov 15, 2021 15:15:40 GMT
And now it's negative. The recorded global temperature for previous years: 2015 average: 0.98 °F (0.54 °C) below normal 2016 average: 0.48 °F (0.27 °C) below normal 2017 average: 0.47 °F (0.26 °C) below normal 2018 average: 1.33 °F (0.74 °C) below normal 2019 average: 0.65 °F (0.36 °C) below normal 2020 average: 0.00 °F (0.00 °C) below normal |
|
|
|
Post by douglavers on Nov 15, 2021 22:28:32 GMT
Add suburban Hobart [Tasmania South Coast] to the list of Oz places covered in snow yesterday. Presumably, most of the central highlands were completely covered.
We have had consistent winds from the Southern Ocean, coming off a very cold Antarctica. I have never seen them as persistant as this.
|
|
|
|
Post by douglavers on Nov 15, 2021 22:35:48 GMT
[[Global Temperatures are dropping rapidly. I am rather surprised how fast!
temperature.global/And now it's negative.
The recorded global temperature for previous years:
2015 average: 0.98 °F (0.54 °C) below normal
2016 average: 0.48 °F (0.27 °C) below normal
2017 average: 0.47 °F (0.26 °C) below normal
2018 average: 1.33 °F (0.74 °C) below normal
2019 average: 0.65 °F (0.36 °C) below normal
2020 average: 0.00 °F (0.00 °C) below normal]]
I don't understand comment. Figures would appear to suggest temperatures are rising?
|
|
|
|
Post by Sigurdur on Nov 15, 2021 23:21:25 GMT
|
|
|
|
Post by walnut on Nov 16, 2021 3:26:36 GMT
And now it's negative. The recorded global temperature for previous years: 2015 average: 0.98 °F (0.54 °C) below normal 2016 average: 0.48 °F (0.27 °C) below normal 2017 average: 0.47 °F (0.26 °C) below normal 2018 average: 1.33 °F (0.74 °C) below normal 2019 average: 0.65 °F (0.36 °C) below normal 2020 average: 0.00 °F (0.00 °C) below normal I'd really like to know more about their "QC server" before I continue to be excited about their pronouncements. They receive unadjusted data. But then what? |
|
|
|
Post by Sigurdur on Nov 16, 2021 3:35:19 GMT
And now it's negative. The recorded global temperature for previous years: 2015 average: 0.98 °F (0.54 °C) below normal 2016 average: 0.48 °F (0.27 °C) below normal 2017 average: 0.47 °F (0.26 °C) below normal 2018 average: 1.33 °F (0.74 °C) below normal 2019 average: 0.65 °F (0.36 °C) below normal 2020 average: 0.00 °F (0.00 °C) below normal I'd really like to know more about their "QC server" before I continue to be excited about their pronouncements. They receive unadjusted data. But then what? They don't adjust. It is a continuous feed of temperatures. |
|
|
|
Post by walnut on Nov 16, 2021 3:48:57 GMT
I'd really like to know more about their "QC server" before I continue to be excited about their pronouncements. They receive unadjusted data. But then what? They don't adjust. It is a continuous feed of temperatures. That's what I thought but how to be sure? What is a "QC processor"? For NOAA, that term means data manipulation, arbitrary outlier dropping etc.
Temperature.global says that they "use" unadjusted surface temp data.
Not meaning to be disagreeable, I hope that you are right. Is their "QC processor" a quad-core processor, or a quality control processor?
|
|
|
|
Post by acidohm on Nov 16, 2021 20:54:18 GMT
Apologies I can't help myself.....models are going crazy but you could post charts like this at this range all the time and just come across as hysterical. However....Look At That Chart!!!! 2010 re-run!! 😲 And here we are, European model today. They're all like this atm! Note the forecast date however....event moved from 19th to 25th.... |
|