|
|
Post by acidohm on Apr 25, 2023 18:28:42 GMT
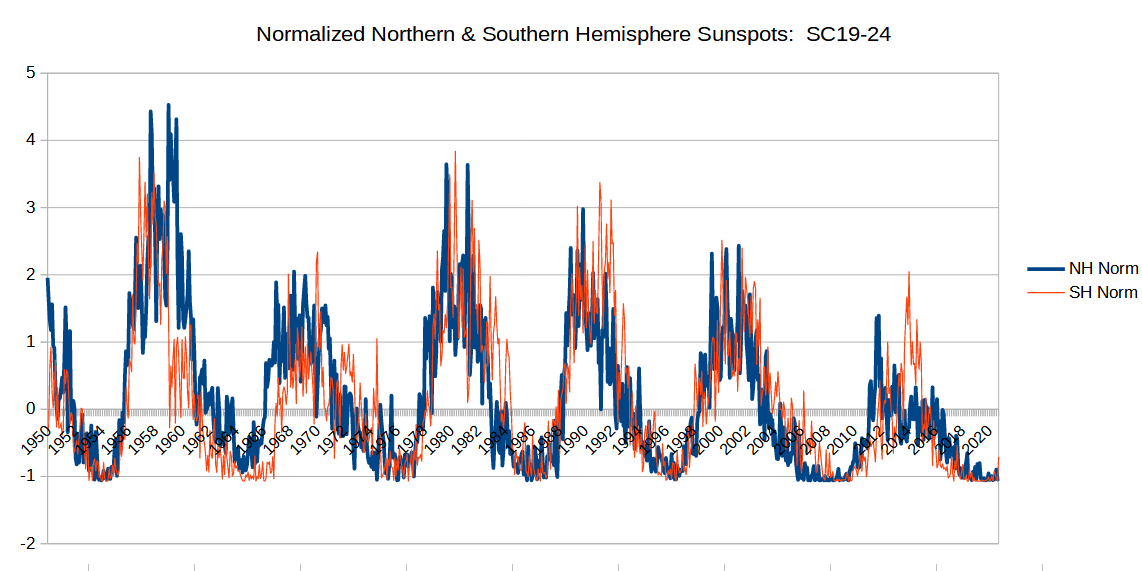
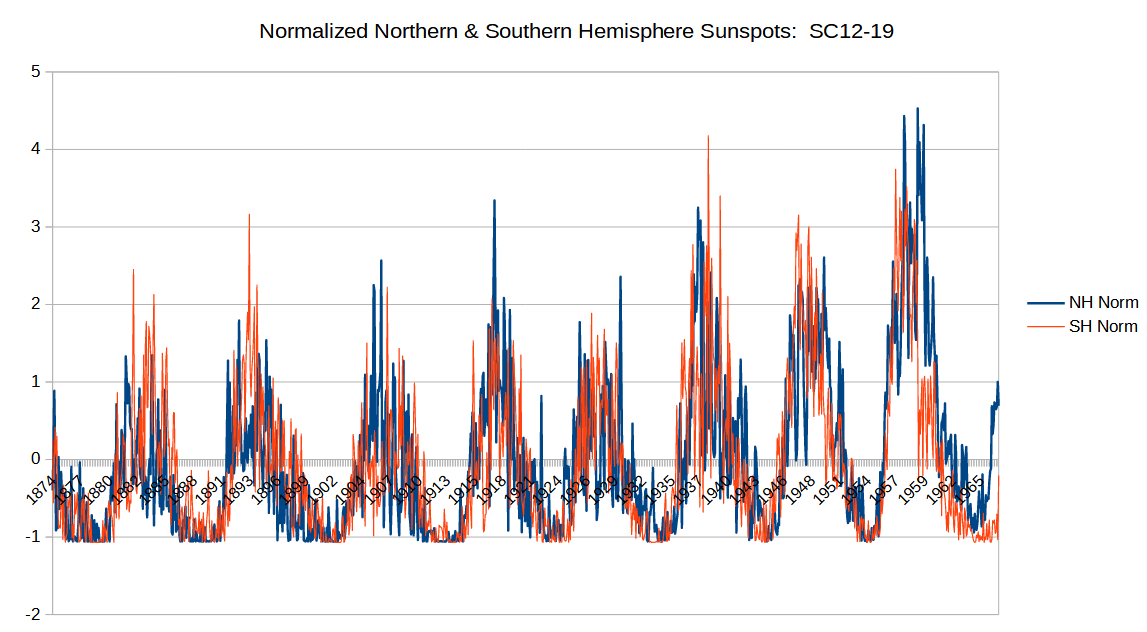
Have to run to an appointment. Here is the first cut by hemisphere.   Ooooooh, Mr.M you absolute legend!!! 👏🏻👏🏻👏🏻 |
|
|
|
Post by acidohm on Apr 25, 2023 18:29:17 GMT
First glance, 24 was quite unusual!
|
|
|
|
Post by missouriboy on Apr 25, 2023 18:42:20 GMT
First glance, 24 was quite unusual! Where were you finding your monthly hemispheric sunspots for SC25? They aren't on SILSO. |
|
|
|
Post by duwayne on Apr 25, 2023 21:29:17 GMT
Missouriboy, try this download link for the 13-month smoothed sunspot numbers from SILSO.
|
|
|
|
Post by acidohm on Apr 26, 2023 4:39:55 GMT
|
|
|
|
Post by ratty on Apr 26, 2023 5:16:53 GMT
First glance, 24 was quite unusual! How so? |
|
|
|
Post by nonentropic on Apr 26, 2023 7:15:48 GMT
asymmetric peak between north and southern hemisphere in SC24.
That from a rank amateur.
what it tells me though is that maybe a task for MB could be to realigning the hemispherical peaks to coordinate, thus generating a peak solar activity, or even separating the hemispheres to see the individual hemispherical activity.
One may be hiding behind the other??
|
|
|
|
Post by ratty on Apr 26, 2023 8:01:42 GMT
asymmetric peak between north and southern hemisphere in SC24. That from a rank amateur. what it tells me though is that maybe a task for MB could be to realigning the hemispherical peaks to coordinate, thus generating a peak solar activity, or even separating the hemispheres to see the individual hemispherical activity. One may be hiding behind the other?? Careful! That could sound like manipulation/homogenization. |
|
|
|
Post by missouriboy on Apr 26, 2023 14:31:29 GMT
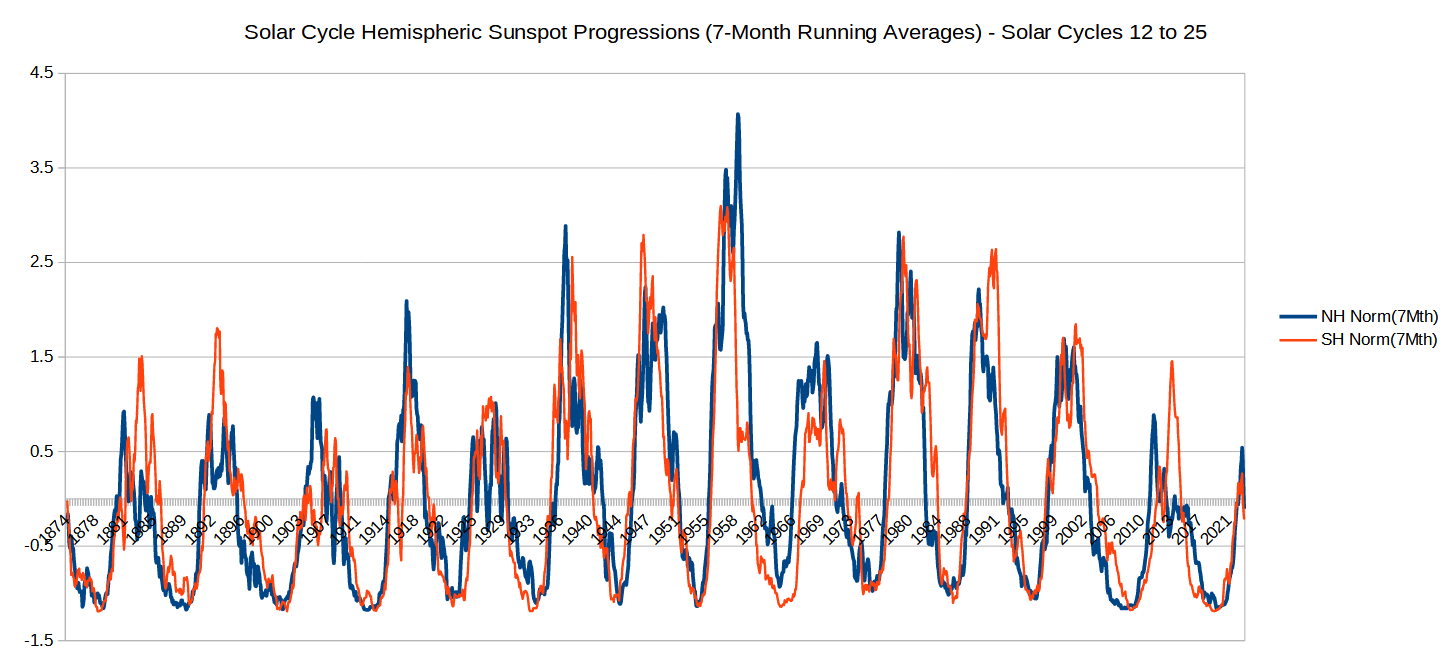
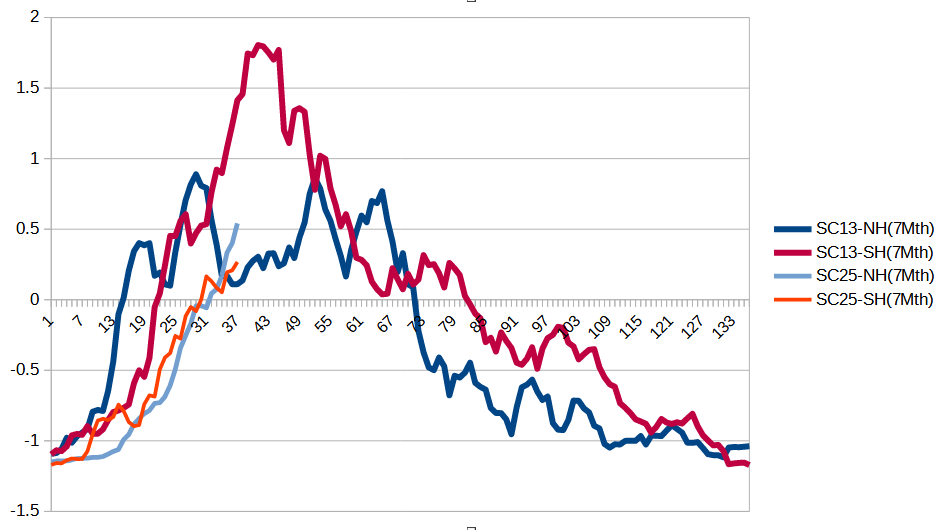
Here you are Non. The solar cycle hemispheric sunspot progression for solar cycles 12 to 24 with a 7-month running average. A little easier to see the trends. Then a cycle stacking to observe the difference in trends between cycles.
Note the similarity of SC24 to SC12. The SC12-SC24 progression is shown in Chart 2 Right. Hard to get any closer than that visually. Chart 2 Left shows the SC12 and SC13 progressions. Northern hemisphere of SC13 remains very similar to SC12 ... but the southern hemisphere peak shifts left. I don't have the monthly SC25 progression plugged in yet, but a look at Acid's previous chart seems to show the northern and southern hemispheres moving together to the first peak. We'll see if it's alike to SC13.
So how do weather patterns of 1878 to 1890 (SC12) and 1890 to 1902 (SC13), together with other climate indicators compare to what we have/are seeing in SC24 and SC25? We have seemingly had a buildup of heat in the oceanic system (the big hot tub) ... although perhaps exaggerated by those that feed the modeling crews. How have primary atmospheric patterns compared?
Solar Cycle 25 has now been updated.
Thanks duwayne. I've now updated the hemispheric sunspot values for SC25 and they are plotted as they third chart row. The SC25 progression seems to be falling away from (below) the SC13 progression. The southern hemisphere in particular is not running up as dramatically as in SC13. We will see where this goes.
   |
|
|
|
Post by code on Apr 26, 2023 15:32:03 GMT
Missouri, Love your graphs, here is technical information
|
|
|
|
Post by missouriboy on Apr 26, 2023 17:31:45 GMT
Thanks. I tried to plug it in, but my laptop fainted.  |
|
|
|
Post by ratty on Apr 26, 2023 23:38:54 GMT
Thanks. I tried to plug it in, but my laptop fainted.  Yep. Hard to un-see that.  |
|
|
|
Post by duwayne on Apr 27, 2023 2:38:30 GMT
Missouri, I appreciate the effort you put in to make your charts for our benefit. I am wondering, however, whether the Cycle 25 7-month average numbers for each of the 2 hemispheres are actually declining recently as depicted in your chart.
Unfortunately the SILSO data I provided the link for are 13-month smoothed hemispherical numbers, not individual hemispherical monthly values so they may not fit with your other numbers. They are still showing an uptrend.
Also, if I look at the total monthly sunspot numbers made up of both hemispheres and calculate a moving 7-month average, it shows a steady upward trend through the end of March.
|
|
|
|
Post by acidohm on Apr 27, 2023 4:34:32 GMT
30 day trend  I can see 7 month trends on this site which show upward....but the line terminates at a point 7 months ago. I'm guessing it's difficult to show a trend in a shorter duration then it's target time?  |
|
|
|
Post by acidohm on Apr 27, 2023 4:55:18 GMT
To add further thoughts and elaborate on why Missouris find of historic Hemispheric data is wonderful.
Generally, total sunspot numbers are offered a metric of solar activity, a cycle will reach a maximum eg, 200.
However, behind that the number is a sum of the activity of both hemispheres which as is all the more apparent now, may be coupled or uncoupled.
The peak number can be both hemispheres summing up at once, or, as in 24 so clearly, may be the sum of one hemisphere, uncoupled from the other.
A twin peak cycle is an uncoupled cycle.
My particular interest in this is while observing the progression of the current cycle with a view in where this may be heading.
I hypothesise that observing the coupling can give a better idea of what the future outcome might be then looking at total ssn.
Currently, this cycle is coupled so the total ssn is a sum of both hemisphere. This to me suggests an overall weaker cycle then 24, where by this point hemispheres were uncoupled at total ssn was a function of single Hemispheric output.
We are also looking most likely at a single peak cycle is my guess.
What causes Hemispheric coupling is something that I can't explain (any info gratefully received). Are the hemispheres teleconnected or are we observing random flux.
Further, would a cycle peak ssn be useful as expressed as seperate hemisphere combined total rather then viewed as whatever the highest total is? A peak ssn from an uncoupled cycle is perhaps apparently lower then a similar, in overall output, coupled cycle?
|
|