|
|
Post by acidohm on Dec 13, 2022 20:56:35 GMT
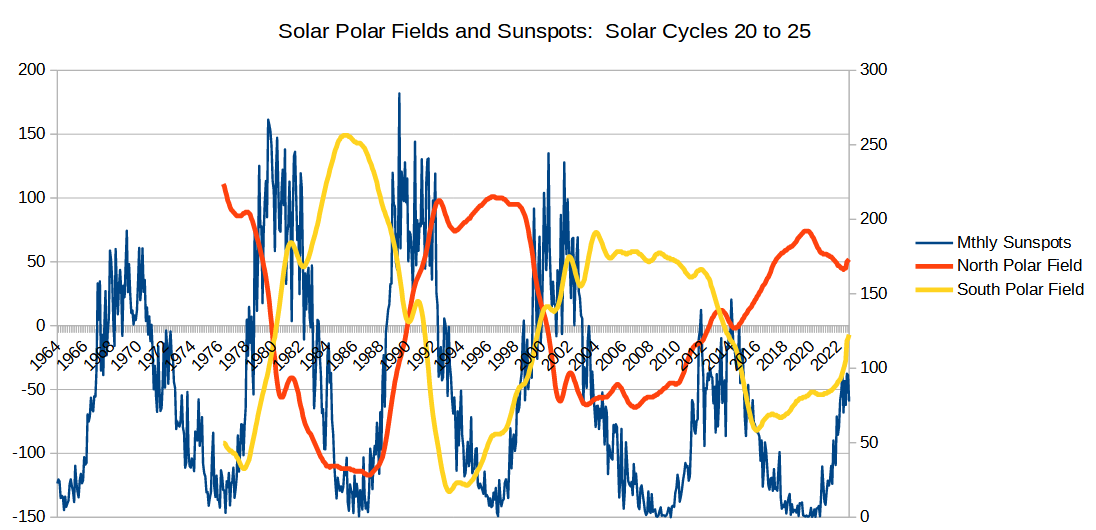
I went back to the north and south polar field values and assigned the first monthly observation as the value for each month (same as the merged fields values). This punches my dance card. Quite obvious that the sunspot cycles kick off as the polar fields move towards the equator, and die down as the polar fields exit toward the opposite poles. I foresee a lot of crow being eaten by the Charles Oscar crowd.  I'm not sure I understand the points you are making. Is there some insight you've gained by looking at the North Polar Field and South Polar Field separately? Who is the Charles Oscar crowd? Less a crowd...more a couple  |
|
|
|
Post by missouriboy on Dec 13, 2022 22:16:22 GMT
I went back to the north and south polar field values and assigned the first monthly observation as the value for each month (same as the merged fields values). This punches my dance card. Quite obvious that the sunspot cycles kick off as the polar fields move towards the equator, and die down as the polar fields exit toward the opposite poles. I foresee a lot of crow being eaten by the Charles Oscar crowd. So....this cycle ain't near reaching peak yet 🤔 Second peak was highest on 24 ... and that would be about 30(?) months from now IF the progression is similar. Micro Tesla units -
 |
|
|
|
Post by missouriboy on Dec 13, 2022 22:30:43 GMT
I went back to the north and south polar field values and assigned the first monthly observation as the value for each month (same as the merged fields values). This punches my dance card. Quite obvious that the sunspot cycles kick off as the polar fields move towards the equator, and die down as the polar fields exit toward the opposite poles. I foresee a lot of crow being eaten by the Charles Oscar crowd. I'm not sure I understand the points you are making. Is there some insight you've gained by looking at the North Polar Field and South Polar Field separately? Who is the Charles Oscar crowd? I remember Dr Leif and others describing the sunspot cycle growing as the polar fields converge/interact toward the equator. Both fields make it stand out to me. |
|
|
|
Post by duwayne on Dec 14, 2022 1:05:15 GMT
Cycle 25 will be weaker than 24 is the message I'm getting from this and other stuff I've skimmed, eg Valentina Zharkova. What are the odds of another Maunder? These papers were written long before the latest solar polar peak was completed. Therefor, they did not have solar polar peak information which was generated in the later part of sunspot cycle 24 necessary for predicting the maximum sunspot peak of cycle 25 which would follow.
Because the last and latest solar polar peak was higher than the previous solar polar peak (see the charts), it's logical to expect the sunspot peak which will follow later in sunspot cycle 25, will not be a low one of the Maunder minimum type.
In sumary, I think the speculation in the papers concerning the possibility of a Maunder minimum ahead was before the recent higher solar polar peak numbers and those people might now expect a cycle 25 sunspot peak to be in the range of cycle 24 since they mention the predictive power of the solar polar peak.
|
|
|
|
Post by nonentropic on Dec 14, 2022 1:29:25 GMT
The peak looks quite close if that convergence is a true metric I also suspect that the peak is not 2 or 3 years away but maybe 1 or 2 years.
Than from a real solar expert, not!
|
|
|
|
Post by missouriboy on Dec 14, 2022 23:13:10 GMT
|
|
|
|
Post by blustnmtn on Dec 14, 2022 23:37:21 GMT
That’s a good comparison Mo’Boy. A comparison to visit periodically. Ratty needs to give you a raise soon. |
|
|
|
Post by missouriboy on Dec 14, 2022 23:56:01 GMT
That'll be the day.  |
|
|
|
Post by missouriboy on Dec 15, 2022 7:16:56 GMT
|
|
|
|
Post by ratty on Dec 15, 2022 11:49:32 GMT
That'll be the day.  Just give me a holler, buddy. |
|
|
|
Post by missouriboy on Dec 17, 2022 6:23:46 GMT
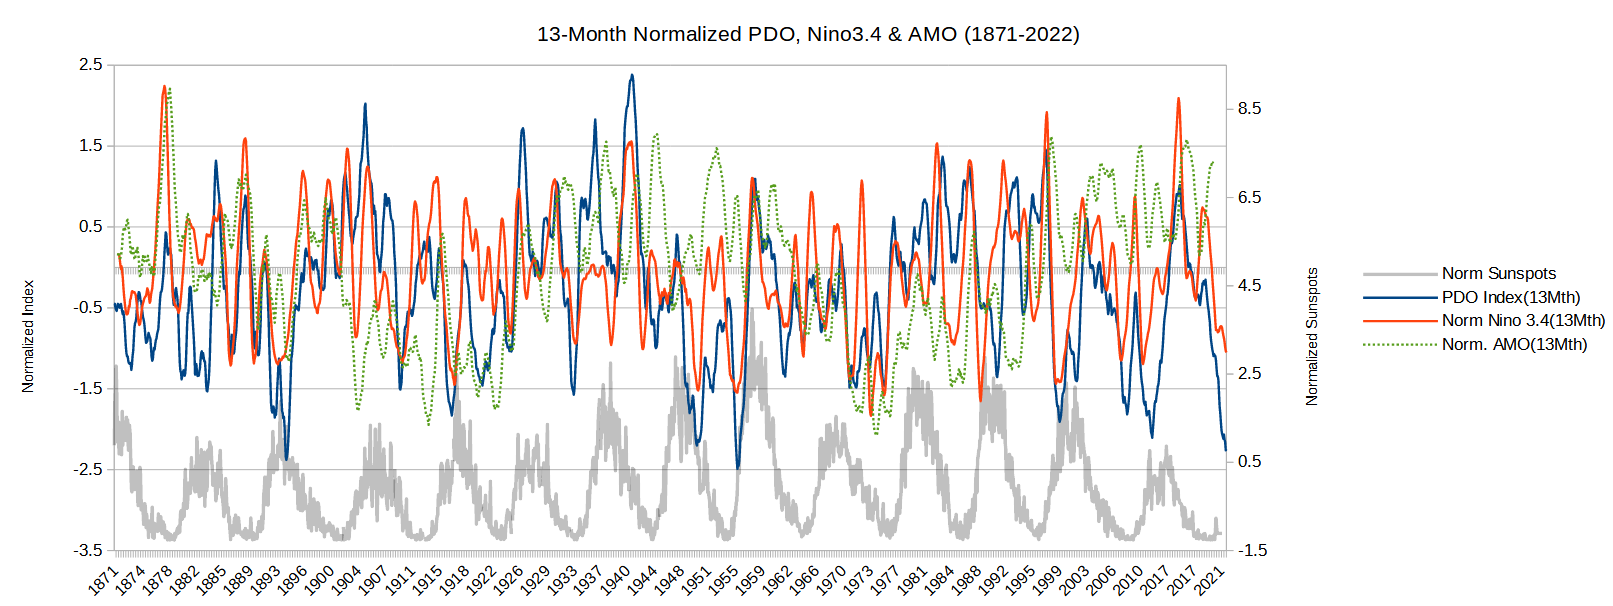
The PDO has reached it's lowest value since 1953, on the front end of SC19 ... our postulated 60-70 year break point. Previous one before that was 1893. Each is separated by six solar cycles PDO generally runs in sequence with ENSO. An ENSO pulse in mid-equatorial-Pacific generally shows up as a warm pulse in the NE Pacific. The latest downturn also coincides with a strong negative IOD, unusually warm water in the eastern Indian Ocean. This also occurred in the 1950s and 1890s.
 |
|
|
|
Post by duwayne on Dec 17, 2022 14:52:51 GMT
That's a nice chart. The Multivariat Enso (MVENSO) also shows the quasi 60-year cycle. A chart with 30-year moving averages for the MVENSO, PDO and AMO, each of which is measuring a different part of the Ocean Current system, will support the notion that the global temperatures during the 1977-2007 period were driven upward by the Ocean Current cycle. The warmist crowd claimed it was CO2 alone that was driving temperatures up and calculated a CO2 Sensitivity accordingly. This was plugged into the models and voila, the craziness followed.
|
|
|
|
Post by missouriboy on Feb 1, 2023 18:56:22 GMT
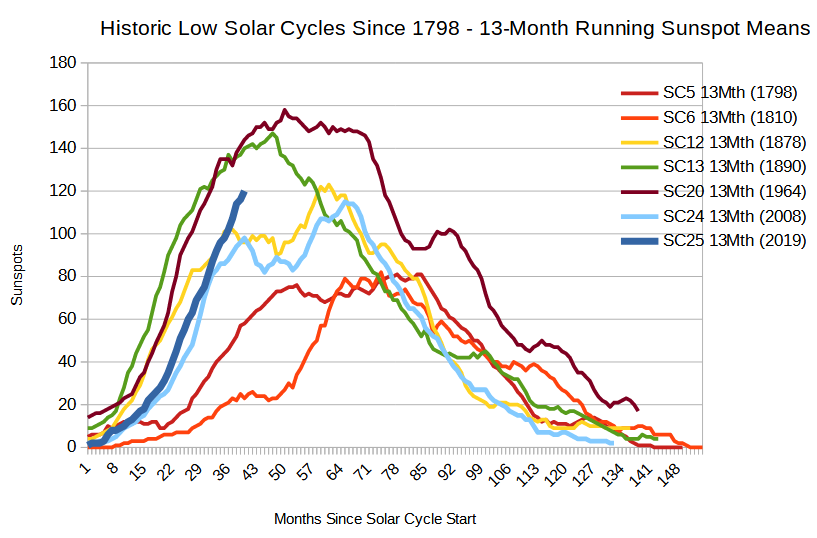
January 2023 showed a spike in sunspot activity ... slightly later than SC24, which lost it's center over the next two years. SC24 & SC25 seems right in line with SC12 ... the first cycle of the Centennial Minimum. Except that SC13 was stronger than SC12. So ... The 21st Century Minimum is on track (so far) to be lower in aggregate. The hard winters of SC12 are shown in the 2nd chart along with Krakatoa, which, interestingly, occurred more toward the second peak. A decade of excitement awaits us. Dr Leif should be happy with his forecast. AMO comparison from chart above duwayne's post. Note the start of a decline at the beginning of SC13, which then rebounded before its dramatic collapse at the end of SC13.  |
|
|
|
Post by missouriboy on Feb 8, 2023 18:22:51 GMT
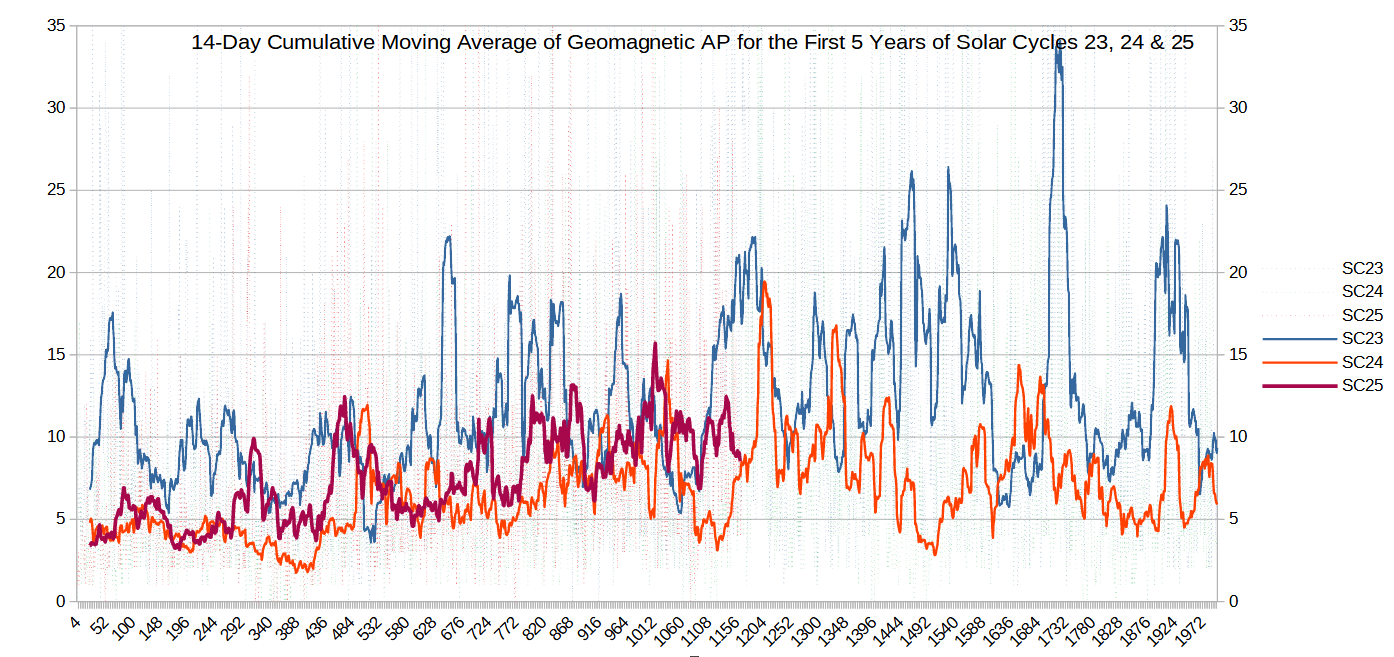
Since we are following sunspots, I thought that a visual on geomagnetic activity might be useful. Note the SC24 spike in geomagnetic activity at day ~1200, lasting the better part of March 2012. We had a much warmer than normal February that year, followed by double the average spring precipitation ... then the 2012 summer drought.  |
|
|
|
Post by missouriboy on Feb 9, 2023 23:57:33 GMT
Historical Total Solar Irradiance Reconstruction, Time Series (1610-2018) [climate.nasa.gov].  |
|