|
|
Post by ratty on Dec 11, 2022 1:03:22 GMT
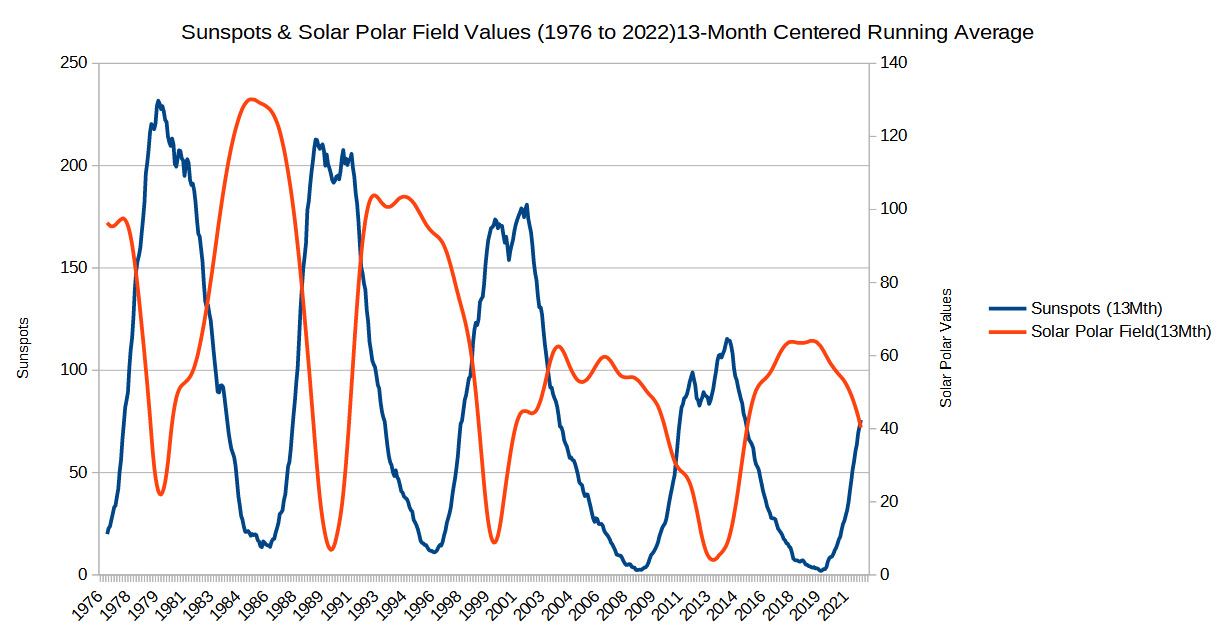
I'm probably missing something ... but how is the solar polar field index calculated for what appears to be 6 years in advance of present? So maybe your last post partially explains that. Any idea on the separation period between the last sunspot point and the last solar polar field point? What I obviously didn't make clear is that the bottom time scale applies only to the sunspot scale. In order to line up the peaks, I had to slide the timescale of one of the series. I slid the solar polar series to the right because, according to hypothesis, it leads the sunspot number. I didn't calculate a separation point between the peaks because it didn't appear to me that there was a repeatable separation difference. Although it would be nice if it did, the peak time does not appear to repeat either within the sunspot or solar polar cycle series or in a comparison between them.
Also, there is not a close similarity of shapes amongst or between the various cycles. And Svalgaard is not saying there is.
He is limiting his observation to the similarity in "proportional size" of the peaks between the solar polar cycles and the subsequent sunspot cycles.
I appreciate the questions. Hopefully, that clarifies what I have done. By the way, Missouriboy, it took me a fair amount of time to create the chart and it make makes me appreciate more the effort you put into the charts you post.
Duwayne, I think you are echoing the sentiments of all our regular participants. Thanks for saying it in a serious fashion (unlike my " you're worth more money / I'll talk to management about a pay rise" comments). Thanks Missouri for all that you contribute here. Thank you too Duwayne.  |
|
|
|
Post by blustnmtn on Dec 11, 2022 1:10:37 GMT
This may have nothing to do with anything but I find it interesting that the “duty cycle” for 24’s polar field predictor is quite wide compared to 25’s. With so few cycles of polar data vs sunspot data, perhaps the total integrated power of the polar field “pulse” is a factor. Just thinking out loud.
|
|
|
|
Post by missouriboy on Dec 11, 2022 1:49:27 GMT
I'm probably missing something ... but how is the solar polar field index calculated for what appears to be 6 years in advance of present? So maybe your last post partially explains that. Any idea on the separation period between the last sunspot point and the last solar polar field point? What I obviously didn't make clear is that the bottom time scale applies only to the sunspot scale. In order to line up the peaks, I had to slide the timescale of one of the series. I slid the solar polar series to the right because, according to hypothesis, it leads the sunspot number.
I didn't calculate a separation point between the peaks because it didn't appear to me that there was a repeatable separation difference. Although it would be nice if it did, the peak time does not appear to repeat either within the sunspot or solar polar cycle series or in a comparison between them.
Also, there is not a close similarity of shapes amongst or between the various cycles. And Svalgaard is not saying there is.
He is limiting his observation to the similarity in "proportional size" of the peaks between the solar polar cycles and the subsequent sunspot cycles.
I appreciate the questions. Hopefully, that clarifies what I have done.
By the way, Missouriboy, it took me a fair amount of time to create the chart and it make makes me appreciate more the effort you put into the charts you post.
I really need to dig into the solar polar cycle data. First assumption is that those data are not necessarily "fixed interval", which would account for the spread. More worrying would be the downward slope at the end of that series. If it is already declining, we may be in for some surprises ... given we are only at the first SC25 peak.
Yes ... the analysis and charting take time. Fortunately I don't have a "day job".  |
|
|
|
Post by ratty on Dec 11, 2022 2:02:41 GMT
[ Snip ] Fortunately I don't have a "day job".  I beg to differ .....  |
|
|
|
Post by duwayne on Dec 11, 2022 20:49:23 GMT
This may have nothing to do with anything but I find it interesting that the “duty cycle” for 24’s polar field predictor is quite wide compared to 25’s. With so few cycles of polar data vs sunspot data, perhaps the total integrated power of the polar field “pulse” is a factor. Just thinking out loud. blustnmtn, I feel good that you asked that question. I actually made my graph to highlight the question you are asking. I asked the same general question in an earlier post when I posted just the solar polar graph by itself which swirled above and below the zero x-axis. Does the "width" of the solar polar peak matter when predicting the sunspot number peak or is it just the height that is important?
As you say, so far, it looks like there is going to be a significant difference in the last two solar polar cycle widths even though the peaks are of similar height. That's the value of looking at the two peaks on the plus side of the axis.
Of course, one could always go one step further and overlay the last 2 solar polar cycles on each other to get an even better comparison.
|
|
|
|
Post by blustnmtn on Dec 11, 2022 21:10:41 GMT
This may have nothing to do with anything but I find it interesting that the “duty cycle” for 24’s polar field predictor is quite wide compared to 25’s. With so few cycles of polar data vs sunspot data, perhaps the total integrated power of the polar field “pulse” is a factor. Just thinking out loud. blustnmtn, I feel good that you asked that question. I actually made my graph to highlight the question you are asking. I asked the same general question in an earlier post when I posted just the solar polar graph by itself which swirled above and below the zero x-axis. Does the "width" of the solar polar peak matter when predicting the sunspot number peak or is it just the height that is important. As you say, so far, it looks like there is going to be a significant difference in the last two solar polar cycle widths even though the peaks are similar. I posted a link earlier in this thread with reference to Leif’s group’s work’s. It contains a plot that is not time shifted but confirms your plot. I didn’t notice the extended weak envelope for the polar field data until your time shifted plot. Here’s a screen shot of it:  |
|
|
|
Post by missouriboy on Dec 11, 2022 21:43:22 GMT
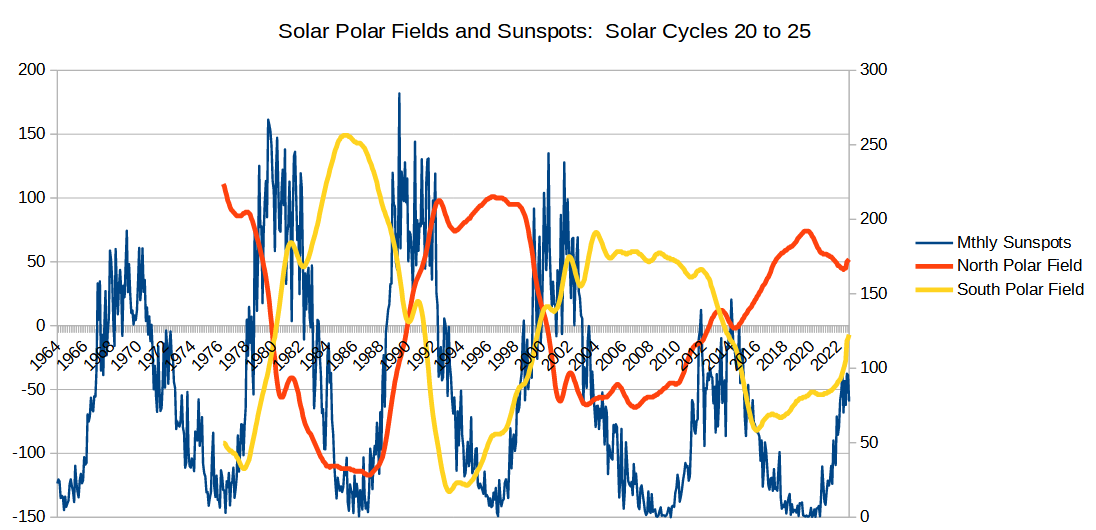
OK. I copied the solar polar fields data file. There is one observation about every 10-12 days. I selected the first observation in every month to represent the month value, then plotted them against sunspots.  |
|
|
|
Post by ratty on Dec 11, 2022 23:36:11 GMT
OK. I copied the solar polar fields data file. There is one observation about every 10-12 days. I selected the first observation in every month to represent the month value, then plotted them against sunspots.  I'll be very keen to hear some interpretations on that graph. |
|
|
|
Post by acidohm on Dec 12, 2022 18:28:57 GMT
|
|
|
|
Post by duwayne on Dec 12, 2022 18:54:44 GMT
OK. I copied the solar polar fields data file. There is one observation about every 10-12 days. I selected the first observation in every month to represent the month value, then plotted them against sunspots.  Great. From my viewpoint what you've done so far is improve the ability to understand the relationship between the solar polar field and the sunspots by showing the solar polar numbers as all positive and by putting them on a scale similar to the sunspot numbers.
It's appears to me from the responses to my chart that people are having trouble relating the peaks. The sunspot peak is similar to the solar polar peak which precedes it in time. How about eliminating the first sunspot cycle from the chart since there is not a full solar polar field cycle to compare it to. The first partial solar polar field cycle could also be eliminated, particularly because its peak isn't shown.
Then I'd suggest sliding the solar polar curve ahead so the peaks match making it easier to visually compare the related solar polar and sunspot peaks and see that they are of a similar height. It would also show the sunspot cycle working its way toward the solar polar cycle peak ahead, the peak which probably will not be exceeded in the current cycle.
|
|
|
|
Post by ratty on Dec 13, 2022 4:34:38 GMT
Cycle 25 will be weaker than 24 is the message I'm getting from this and other stuff I've skimmed, eg Valentina Zharkova. What are the odds of another Maunder? |
|
|
|
Post by missouriboy on Dec 13, 2022 17:11:39 GMT
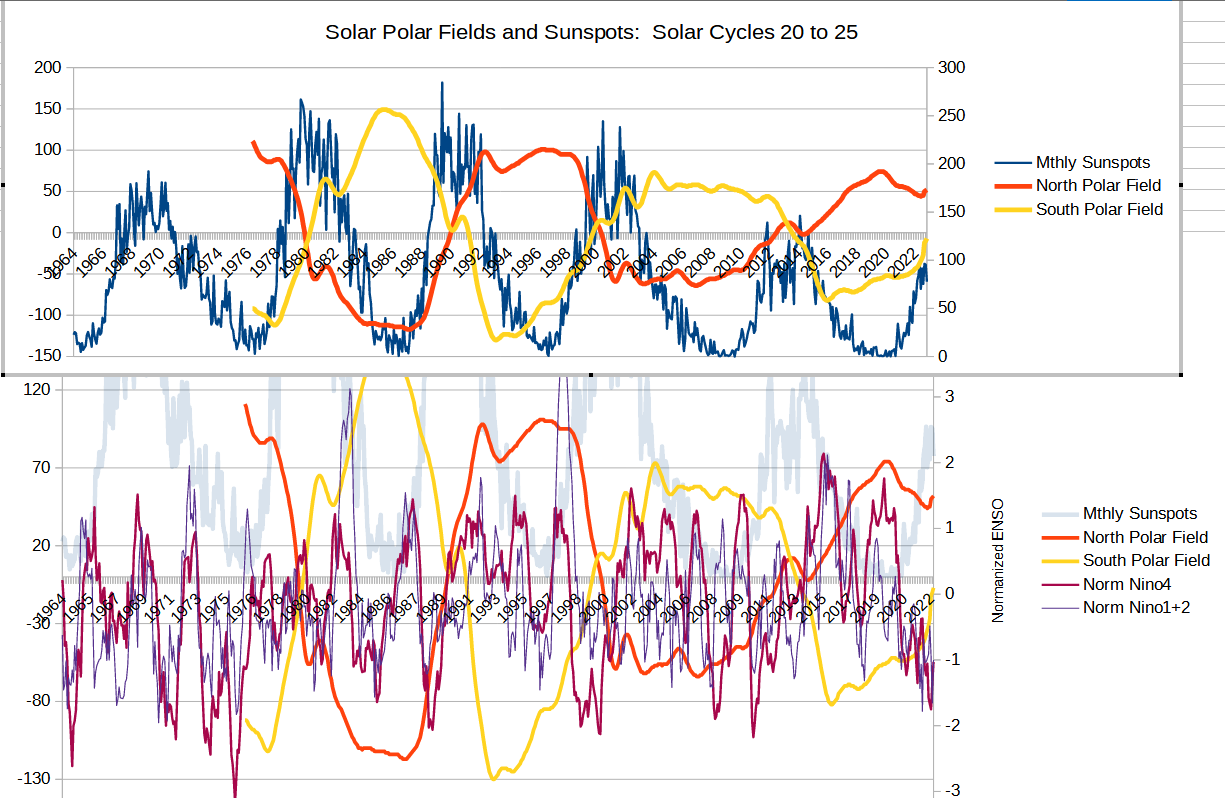
I went back to the north and south polar field values and assigned the first monthly observation as the value for each month (same as the merged fields values). This punches my dance card. Quite obvious that the sunspot cycles kick off as the polar fields move towards the equator, and die down as the polar fields exit toward the opposite poles. I foresee a lot of crow being eaten by the Charles Oscar crowd.  |
|
|
|
Post by missouriboy on Dec 13, 2022 20:23:01 GMT
OLE SPARKEY -AND ENSO

|
|
|
|
Post by duwayne on Dec 13, 2022 20:27:48 GMT
I went back to the north and south polar field values and assigned the first monthly observation as the value for each month (same as the merged fields values). This punches my dance card. Quite obvious that the sunspot cycles kick off as the polar fields move towards the equator, and die down as the polar fields exit toward the opposite poles. I foresee a lot of crow being eaten by the Charles Oscar crowd.  I'm not sure I understand the points you are making. Is there some insight you've gained by looking at the North Polar Field and South Polar Field separately? Who is the Charles Oscar crowd? |
|
|
|
Post by acidohm on Dec 13, 2022 20:55:28 GMT
I went back to the north and south polar field values and assigned the first monthly observation as the value for each month (same as the merged fields values). This punches my dance card. Quite obvious that the sunspot cycles kick off as the polar fields move towards the equator, and die down as the polar fields exit toward the opposite poles. I foresee a lot of crow being eaten by the Charles Oscar crowd.  So....this cycle ain't near reaching peak yet 🤔 |
|


