|
|
Post by blustnmtn on Dec 3, 2022 21:14:35 GMT
|
|
|
|
Post by blustnmtn on Dec 3, 2022 22:04:41 GMT
|
|
|
|
Post by ratty on Dec 3, 2022 22:57:25 GMT
A big benefit of using the peak Solar Polar Field value to predict the peak sunspot number without waiting on more information as to length of time the solar field stays elevated is that it allows the prediction to be made years earlier.
It would be interesting to see a chart of the Solar Polar Field Values (all as positive numbers) plotted along with the Sunspot Numbers. The two series would be scaled so the peaks are similar and the dates would be adjusted so the peaks are coordinated in time. Based on the "Svalgaard Hypothesis" the lines should be pretty similar. Do you have a link to data base containing the solar polar field values? Maybe here: Wilcox Solar Observatory - DATA ? Maybe not. |
|
|
|
Post by missouriboy on Dec 4, 2022 4:03:43 GMT
Good job Ratty ...
But I'm going to need more education to interpret it into a chart.
|
|
|
|
Post by ratty on Dec 4, 2022 5:15:55 GMT
Good job Ratty ...
But I'm going to need more education to interpret it into a chart.
For a small additional fee .....  |
|
|
|
Post by duwayne on Dec 4, 2022 18:09:17 GMT
Good job Ratty ...
But I'm going to need more education to interpret it into a chart.
You are on the trail thanks to Ratty. Open the link you gave above and scroll to the section "Other Quantities".
In that section look for the line: "Solar Polar Field Strength" which is what Svalgaard says drives the sunspot number.
Click on the "Table" link.
Use the values on the far right hand column of the Table but disregard the sign. The first 3 values are 101, 101, 100.
Let me explain a little further.
The sun, like the earth, has a magnetic (Polar) field. The earth's field is pretty constant, but it does "flip" over long periods of time with the north and south poles changing polarity. Your compass will then point in the opposite direction.
The sun flips polarity approximately every 11 years and this is known as the Solar Cycle.
The overall strength of the Solar field changes significantly over time from zero when the poles flip to high numbers as the "poles gain strength" and peak.
One way of measuring the strength of the general Polar field is to measure the "magnetic charge" at each of the poles and average them. The 2 poles "magnetic values" are of opposite polarity but are of similar strength.
The sunspots are greatly affected by the Polar field but their numbers are driven by the strength of the Solar field, and not by which pole is negative.
The "absolute" numbers in the far right hand column reflect the average Polarity of each of the 2 poles and should be a good indication of the overall relative polar field strength over time if the signs are ignored.
|
|
|
|
Post by acidohm on Dec 4, 2022 21:20:39 GMT
Please excuse my rough scribbling. However, looking at Nh and Sh (green and red solid lines) for cycle 24, correlations can be seen as both hemisphere follow the increase in activity after min. As we know the previous cycle had a significant double peak, and once the nh peaked (red) the 2 hemisphere fell out of sync. Purple lines show correlations.  If we look at the current cycle.....the hemisphere now appear to be out of sync. 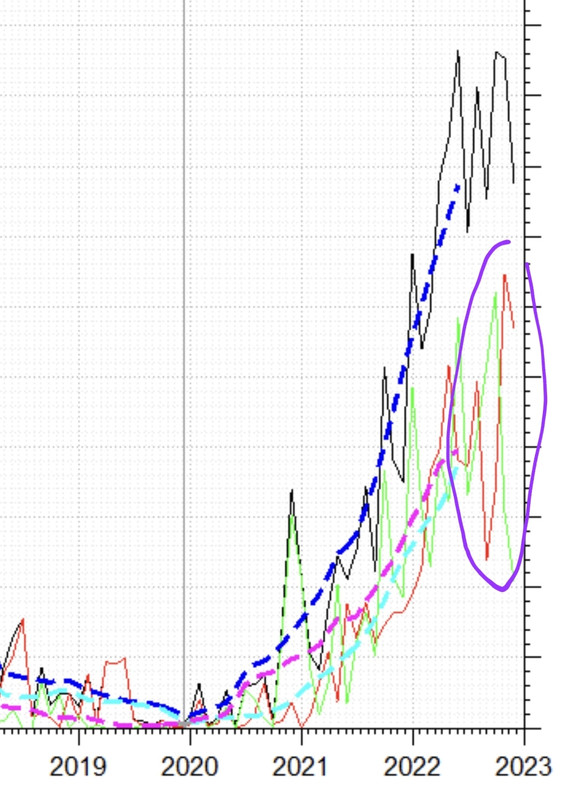 Does this mean anything? Don't know. Be nice to see similar graphs for previous cycles but I don't know where/if they exist... |
|
|
|
Post by ratty on Dec 8, 2022 7:15:06 GMT
|
|
|
|
Post by duwayne on Dec 9, 2022 22:13:58 GMT
Good job Ratty ...
But I'm going to need more education to interpret it into a chart.
You are on the trail thanks to Ratty. Open the link you gave above and scroll to the section "Other Quantities".
In that section look for the line: "Solar Polar Field Strength" which is what Svalgaard says drives the sunspot number.
Click on the "Table" link.
Use the values on the far right hand column of the Table but disregard the sign. The first 3 values are 101, 101, 100.
Let me explain a little further.
The sun, like the earth, has a magnetic (Polar) field. The earth's field is pretty constant, but it does "flip" over long periods of time with the north and south poles changing polarity. Your compass will then point in the opposite direction.
The sun flips polarity approximately every 11 years and this is known as the Solar Cycle.
The overall strength of the Solar field changes significantly over time from zero when the poles flip to high numbers as the "poles gain strength" and peak.
One way of measuring the strength of the general Polar field is to measure the "magnetic charge" at each of the poles and average them. The 2 poles "magnetic values" are of opposite polarity but are of similar strength.
The sunspots are greatly affected by the Polar field but their numbers are driven by the strength of the Solar field, and not by which pole is negative.
The "absolute" numbers in the far right hand column reflect the average Polarity of each of the 2 poles and should be a good indication of the overall relative polar field strength over time if the signs are ignored.
Missouriboy, I just looked back at Svalgaard's conversion factor for calculating Peak SSN's from Polar fields and noticed that he is using the "Dipole Moment" value for his formula rather than the average value from the right hand column of the table I referred to above. This is the sum of the 2 Polar values rather than the average or 2 times the number in the right hand column.
For drawing and resizing curves for comparing on the graph it wouldn't matter whether you use the Dipole Moment or the average, but if you want to check Svalgaard's formula you need the Dipole Moment.
I have a little time this afternoon and I'm going to try and make the graph I mentioned and I will post it tomorrow if I'm successful.
|
|
|
|
Post by missouriboy on Dec 9, 2022 23:37:32 GMT
I'm looking forward to it.
|
|
|
|
Post by duwayne on Dec 10, 2022 18:39:23 GMT
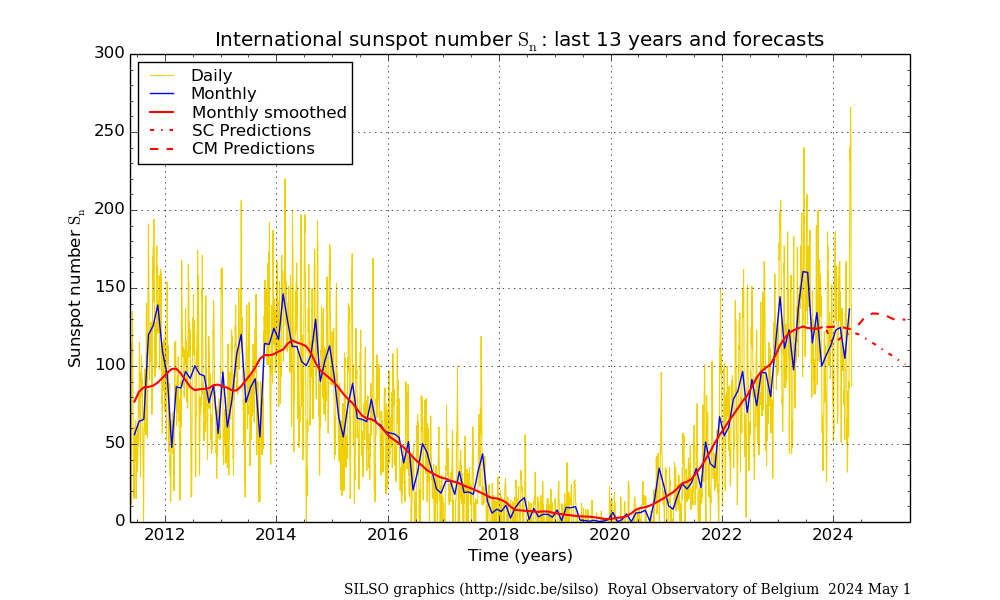
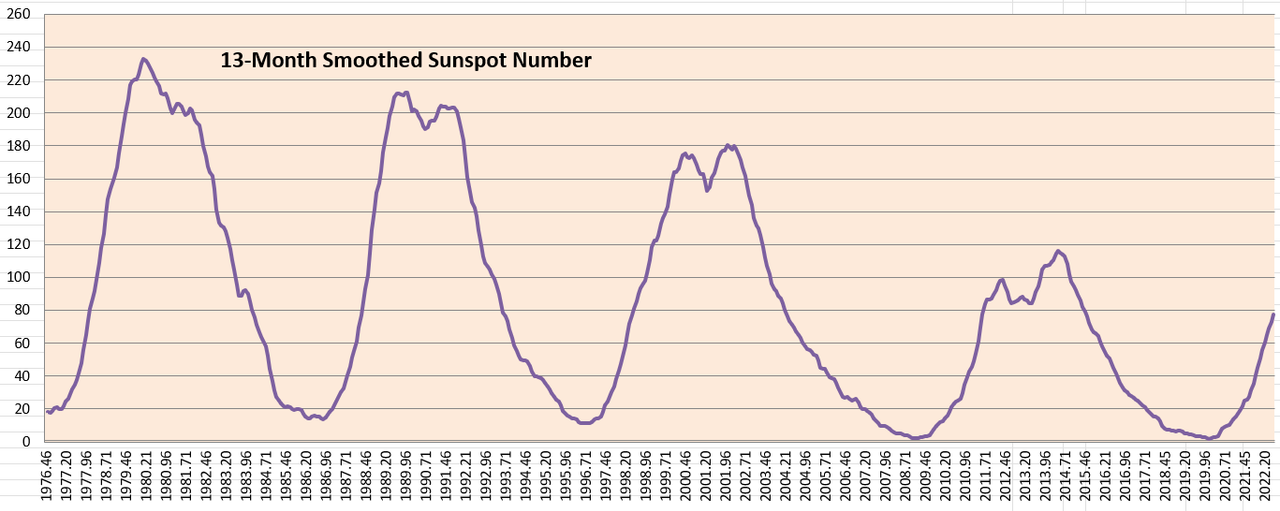
This chart below shows the 13-Month Smoothed Sunspot Number over the last 4+ Cycles.
In the chart below I’ve ratioed and moved forward (to the right) the Solar Polar Field values and overlaid this curve on the previous Sunspot chart. (Neither the value scale on the Chart's left nor the time scale on the bottom match the Solar Polar Field values. I just made the Solar Polar Field Cart and dropped it onto the Smoothed Sunspot Chart at scaled size timing to make a comparison easier.
It shows that the Solar Polar Field peak size, when ratioed, has been a reasonably accurate precursor of the Sunspot Number peak size.
Now, the Smoothed Sunspot Number is dutifully climbing up toward the Solar Polar Field Index peak.
A key takeaway for me is that if there is going to be a major dimming of the sun, it’s likely we’ll see an indication via an unusually low Solar Polar Field several years before it becomes apparent in the lack of sunspots. |
|
|
|
Post by nonentropic on Dec 10, 2022 18:57:12 GMT
So the solar polar peak is sliding behind the sunspot number chart and the amplitude of the sunspot chart is falling, maybe??
|
|
|
|
Post by duwayne on Dec 10, 2022 20:39:54 GMT
So the solar polar peak is sliding behind the sunspot number chart and the amplitude of the sunspot chart is falling, maybe??
The far right ends of each of the 2 lines are the latest (current) values.
The time scale on the bottom axis applies only to the sunspot numbers.
The scale for the solar polar line would be about 5 years to the right of the sunspot scale.
So the sunspot number is following behind the solar polar number toward its peak from some 3 years ago.
|
|
|
|
Post by missouriboy on Dec 10, 2022 20:48:36 GMT
I'm probably missing something ... but how is the solar polar field index calculated for what appears to be 6 years in advance of present? So maybe your last post partially explains that. Any idea on the separation period between the last sunspot point and the last solar polar field point?
|
|
|
|
Post by duwayne on Dec 10, 2022 21:56:50 GMT
I'm probably missing something ... but how is the solar polar field index calculated for what appears to be 6 years in advance of present? So maybe your last post partially explains that. Any idea on the separation period between the last sunspot point and the last solar polar field point? What I obviously didn't make clear is that the bottom time scale applies only to the sunspot scale. In order to line up the peaks, I had to slide the timescale of one of the series. I slid the solar polar series to the right because, according to hypothesis, it leads the sunspot number.
I didn't calculate a separation point between the peaks because it didn't appear to me that there was a repeatable separation difference. Although it would be nice if it did, the peak time does not appear to repeat either within the sunspot or solar polar cycle series or in a comparison between them.
Also, there is not a close similarity of shapes amongst or between the various cycles. And Svalgaard is not saying there is.
He is limiting his observation to the similarity in "proportional size" of the peaks between the solar polar cycles and the subsequent sunspot cycles.
I appreciate the questions. Hopefully, that clarifies what I have done.
By the way, Missouriboy, it took me a fair amount of time to create the chart and it make makes me appreciate more the effort you put into the charts you post.
|
|