Post by duwayne on Jul 14, 2021 18:37:35 GMT
This is a carryover thread from the Cycle24 Board.
I've copied my March 7, 2012 post from the Cycle 24 Board for reference purposes. I refer below to the "old" Board which is the board which was discontinued in 2008.
Much of this is a restatement of what is in the MAXCon 1.0 Model thread which also updates the forecast to reflect the revisions to the UAH anomaly values and the revised numbers which can be compared to the current UAH anomalies.
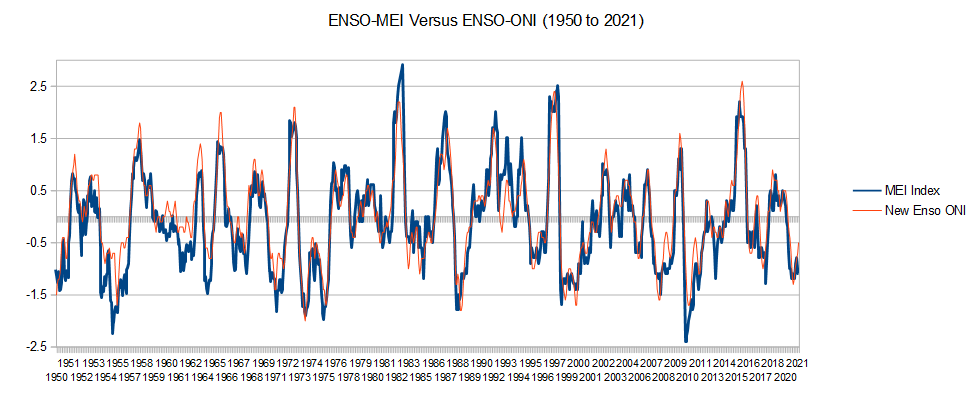
I wanted to save this post since it contains my first attempt to predict the PDO and MVENSO for 2007-2037.
___________________________________________________________________________________________________________________________________
"Here’s my global temperature forecast for the 21st Century along with the basis for same. There’s nothing really new here since the information is covered in previous posts stretching back to the “old” Board. I like to post the forecast every once in a while to encourage others to offer their long-term predictions or to tell me where I’m wrong.
The forecast is based on 6 climate observations.
1) There’s been a definitive 60-year global temperature cycle at least since 1850.
2) The naturally occurring Pacific Decadal Oscillation (PDO) and El Nino/Southern Oscillation (ENSO) are strongly net positive during the 30-year temperature up legs and strongly net negative in the 30-year flat or down periods. This provides a clear explanation for the cycles.
3) The claim by some that reduced aerosol concentrations caused the temperatures to be flat in the 1947-1977 period is not only questionable, but appears to be wrong because….
a) Scientists have been unable to develop clear relationships between aerosols and temperatures for their climate models and instead resort to “fudge factors”. Some aerosols cool such as the volcanic aerosols, but other aerosols warm. Why are the fudge factors right?
b) Before 1947 there were 2 previous 30-year flat or declining periods which were clearly not caused by aerosols. Something which fails even in its attempt to explain only 1 of these 3 flat periods lacks credibility versus something which explains all 3.
c) Temperatures have flattened in the early 21st Century despite accelerated growth in CO2 and no significant aerosol reduction.
4) There is a long-term upward trend in global temperatures which accelerated when CO2 concentrations started to grow rapidly in the first half of the 20th Century. The accelerated growth covering more than 60 years could be mostly caused by of CO2 although an active sun and other natural warming effects may have played a role as well.
5) There’s a clear scientific basis for CO2 driven global warming of about 1.2 C per doubling of atmospheric CO2 concentration.
6) Some scientists believe the climate system may multiply the basic CO2 warming effect on global temperatures through feedbacks by a factor of 3 or even higher while other scientists believe the climate system offsets the primary warming to some degree such that the overall warming is something like 0.7C or even less per doubling of atmospheric CO2 concentration. The observations including those in recent years are more consistent with the lower numbers.
Further discussion
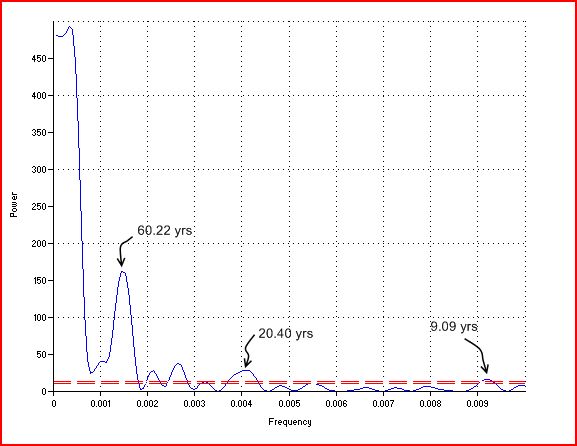
The power of the 60-year global temperature cycle is shown in this periodogram posted on Cycle24 several years ago by “Basil”. The input data were the Hadcrut3 anomalies from 1850 to 2007. The periodogram algorithm searches for periodic cycles in the data. Curves above the double red line are statistically significant, the further above the line the more significant.

The 60-year cycle is both very regular and very statistically significant. The cycle can also be easily seen on a plot of the Hadcrut3 temperature data.
As seen below, for periods when the data are available, PDOs and MVENSOs are significantly net positive over the 30-year periods when global temperatures rise and net negative during the alternate 30-year periods when they are flat.
                  Global
                 Temperature
                   Trend           Average PDO            Average MVENSO

1917-1947     Up                     +0.37                 (No data)
1947-1977     Flat                    -0.63                    -0.29
1977-2007     Up                     +0.43                     +0.38
2007-2011     Flat                    -0.80                     -0.39
Neither the PDO nor the MVENSO remain positive or negative every year throughout the 30-year periods, but on average their tendencies are consistent and in the same direction. There are other Ocean Currents which oscillate over time as well such as the Atlantic Multidecadal Oscillation (AMO). I lump all these together under the general category of Ocean Currents.
Solar activity could have played a role in the overall warming during the 1850-2011+ period and could even have played a significant role as a driver of the Ocean Current oscillation. But other than the 9-13 year solar cycle, a significant solar effect is less obvious and clear, in my opinion, than the roles played by CO2 and the Ocean Currents. However, I would not totally rule out significant cooling from a Maunder Minimum sort of event in the future.
The Forecast
My specific forecast is based on a continuation of the current growth rate of CO2 emissions and is as follows:
The 2007 “trend” temperature is 0.5C based on a least-squares trend of the 1977-2007 Hadcrut3 data. As Ocean Currents shift to the down leg (already evident in the PDO and MVENSO data) and offset CO2 warming, trend temperatures for 2007-2037 will remain flat overall at 0.5C although individual years will fluctuate with ENSO and the 9-13 year solar cycle. For 2037-2067 temperatures will climb on average at the same rate as 1977-2007 to a Hadcrut3 anomaly trend anomaly of 1.0C as Ocean Currents and increasing CO2 push temperatures in the same direction. Then with a reverse in the Ocean Currents Hadcrut3 global temperature anomalies will average around 1.0C for the 2067-2097 period. This will mean the global temperatures will increase about 0.7C from the beginning to the end of the 21st Century. The temperature growth could be slower, if, in fact, there is a significant dimming of the sun or a major volcanic eruption or a large meteor strike occurs.
I labeled my original forecast MaxCon 1.0 with the idea that I would update it to 2.0 or whatever as better information came along on things like aerosols or other temperature drivers such as secular solar activity. So far I’ve seen no reason to update since the Hadcrut3 anomalies are in line with predictions and the PDO turned negative right on schedule in 2007 while the IPCC models with their “no significant natural temperature drivers approach” have greatly overestimated the rate of warming. Others have made forecasts based on Ocean Current effects and they are sometimes similar to mine. I am not claiming originality (the academics worry more about that sort of thing) although I’ve not seen any specific forecast which is a real close match to mine.
Note: updated on 4/9/2012 to replace ONI data with MVENSO data


