|
|
Post by Sigurdur on Nov 9, 2024 15:35:26 GMT
|
|
|
|
Post by ratty on Nov 9, 2024 22:55:30 GMT
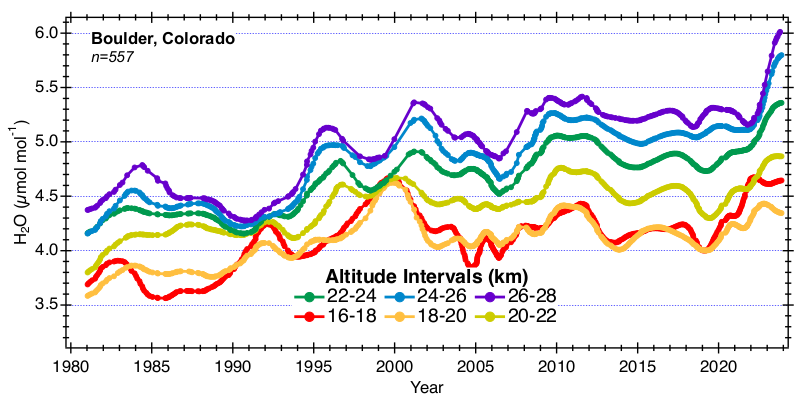
 I'd like to hear some opinions on that graph. I can see the trend but what does it signify? |
|
|
|
Post by nonentropic on Nov 9, 2024 23:25:50 GMT
HT has shown us that there could be a climate impacts from a lift in stratospheric MC. It was a big step-function lift 20% or so.
If that is the case then the impact of aircraft in higher latitudes may be an issue.
Time to ban all private jets and maybe all flights over the arctic down to lat 45N.
Run like that for a 10 year spell and see what happens.
|
|
|
|
Post by ratty on Nov 9, 2024 23:37:31 GMT
HT has shown us that there could be a climate impacts from a lift in stratospheric MC. It was a big step-function lift 20% or so. If that is the case then the impact of aircraft in higher latitudes may be an issue. Time to ban all private jets and maybe all flights over the arctic down to lat 45N. Run like that for a 10 year spell and see what happens. HT and MC? |
|
|
|
Post by Sigurdur on Nov 10, 2024 0:07:55 GMT
HT has shown us that there could be a climate impacts from a lift in stratospheric MC. It was a big step-function lift 20% or so. If that is the case then the impact of aircraft in higher latitudes may be an issue. Time to ban all private jets and maybe all flights over the arctic down to lat 45N. Run like that for a 10 year spell and see what happens. HT and MC? Hunga Tonga =HT Moisture content = MC |
|
|
|
Post by ratty on Nov 10, 2024 0:35:49 GMT
Hunga Tonga =HT Moisture content = MC Thanks ....  |
|
|
|
Post by missouriboy on Nov 10, 2024 15:38:17 GMT
Where is the raw data?  |
|
|
|
Post by walnut on Nov 10, 2024 17:42:17 GMT
Where is the raw data?  Exactly |
|
|
|
Post by Sigurdur on Nov 10, 2024 18:11:36 GMT
|
|
|
|
Post by duwayne on Nov 12, 2024 4:17:17 GMT
 I'd like to hear some opinions on that graph. I can see the trend but what does it signify? This chart is what one would expect. From 1977 to 2007, the earth was warming from a combination of greenhouse gas warming and the warm ocean current cycle. When it warmed, the amount of water in the atmosphere increased because warming air holds more water vapor.
In 2007 the ocean current cycle switched to its cooling phase offsetting the greenhouse gas warming. Global temperatures flattened (as predicted). Water in the atmosphere flattened.
Hunga-Tonga ejected a massive amount of water into the upper atmosphere. That shows up on the right side of the chart.
My guess is these numbers are smoothed. The water injection from Hunga-Tonga does not show as a single injection. These curves will likely turn over over time.
|
|