|
|
Post by Jane in the centre of England on Jul 22, 2022 15:32:31 GMT
Re-found this on the old site. Wonder why it's sooo hot in western Europe? Can some genius out there tell me how to capture a long data set from the underlying data base for specific locations? So they can be compared over longer time periods.
 Look at those Rosby waves!! MJO movement!! Here is a recent article about it: www.nature.com/articles/s41467-022-31432-y. Linking European heatwaves to the double jet stream - whatever that is. |
|
|
|
Post by code on Jul 22, 2022 16:53:37 GMT
Hello Jane!
|
|
|
|
Post by nonentropic on Jul 22, 2022 19:06:51 GMT
Good article Sig. That Joe Nova is a real powerhouse of data and papers.
I think the biggest driver of climate is not temperature but the variability of climate.
Consider the UK/EU currently they have just experienced a heatwave if the weather system were to happen in 5 months there would possibly be a million dead from cold.
The question for me is whether the divergence zone wobble is driven by the season.
Historical reading implies that the LIA was punctuated by heatwaves also. Are we witnessing a modest temperature fall but with elevated variability?
Does the CET have enough texture to see variability?
|
|
|
|
Post by missouriboy on Jul 22, 2022 22:11:13 GMT
Good article Sig. That Joe Nova is a real powerhouse of data and papers. I think the biggest driver of climate is not temperature but the variability of climate. Consider the UK/EU currently they have just experienced a heatwave if the weather system were to happen in 5 months there would possibly be a million dead from cold. The question for me is whether the divergence zone wobble is driven by the season. Historical reading implies that the LIA was punctuated by heatwaves also. Are we witnessing a modest temperature fall but with elevated variability? Does the CET have enough texture to see variability? From 1772, the CET is daily. Before that to 1659 it is provided as monthly means. So yes, you can see variability. |
|
|
|
Post by Sigurdur on Jul 22, 2022 22:32:00 GMT
|
|
|
|
Post by ratty on Jul 23, 2022 4:50:00 GMT
Something similar but simpler was done for Melbourne about ten years (or more?) ago on a local university website. It seems to have disappeared without trace. |
|
|
|
Post by missouriboy on Jul 26, 2022 14:28:57 GMT
Extremes do seem to go together. Very hot, dry period followed by extreme rainfall. Check out the rainfall (7-11 inches) last night in St. Louis, seemingly associated with a mid-summer cold front. That Charles Oscar guy is really something.
|
|
|
|
Post by missouriboy on Jul 26, 2022 16:24:29 GMT
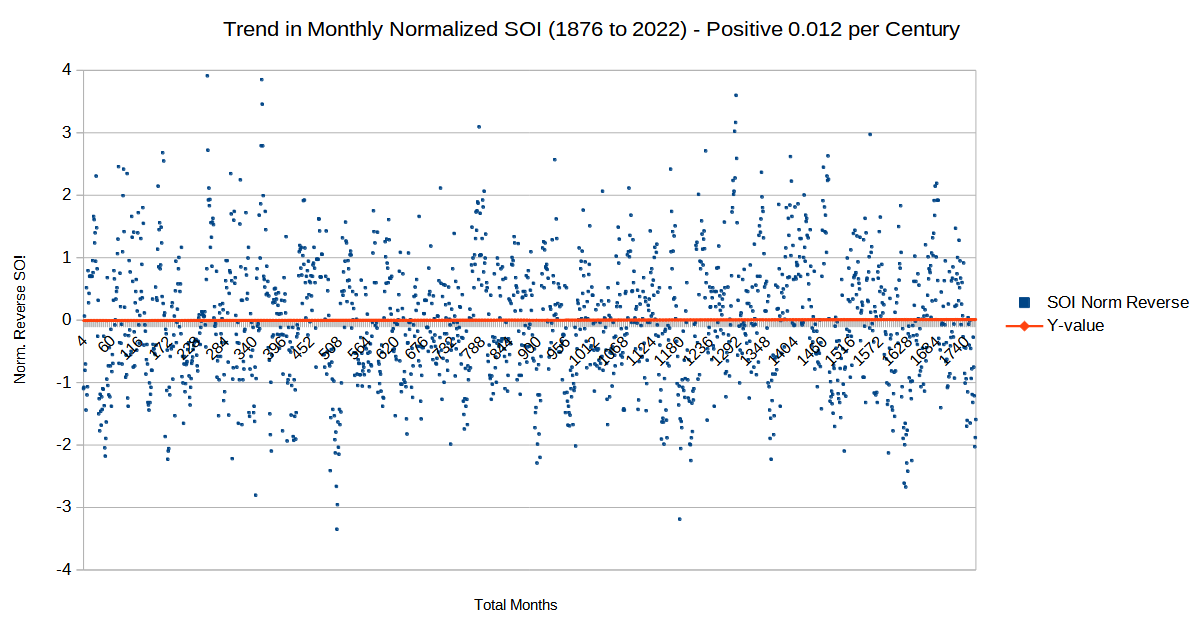
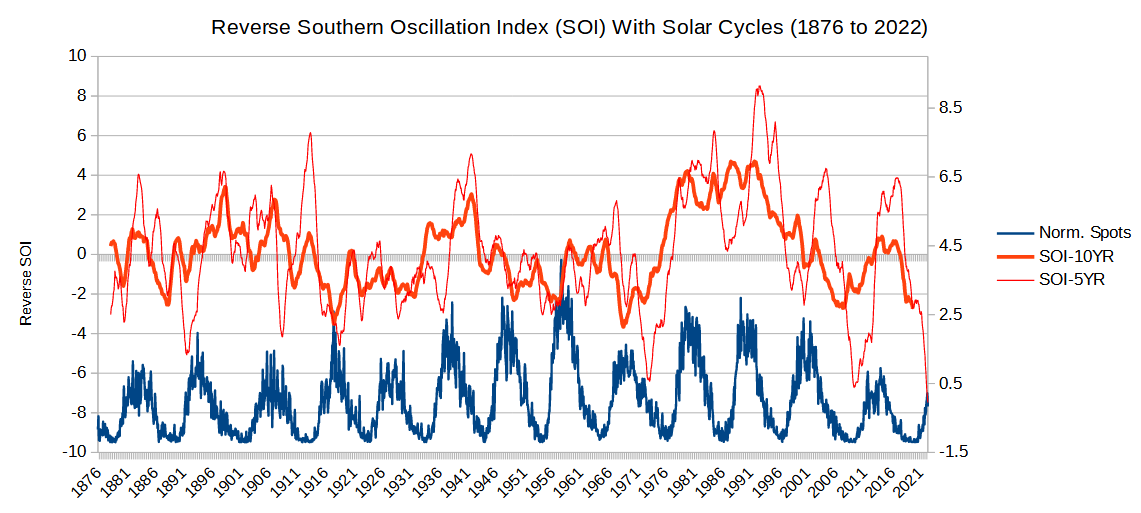
Ocean Atmosphere Response to Solar EMR at Top of the Atmosphere  After reviewing this article's thesis that "longer-term" tropical ocean's SSTs show no statistically significant trend, I was motivated to run a similar analysis on some of our longer-term ocean data bases. Starting with the SOI data that goes back to 1876. Chart 1 below are monthly normalized Reverse-SOI data. Unlike ENSO data, there are no temperature values on SOI. They are pressure differences between Darwin and Tahiti. They are closely correlated with ENSO 3.4 values, which only go back to 1950. A least-squares fit across 147 years (1758 months) show great variance, but essentially no trend. The positive 0.012 per century trend is in pressure-difference units ... not temperature. However, while there may be no significant long-term trend, there are definitely embedded temporal sub-trends in the data that appear to be correlated with solar cycle strength ... as measured by sunspots (Chart 2).
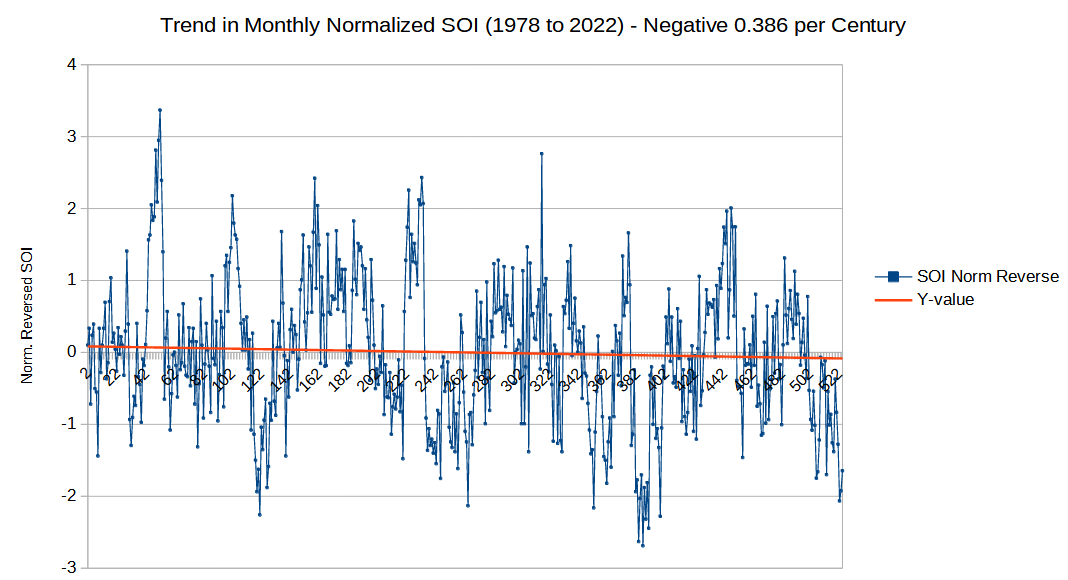
Chart 3 shows the same analysis as Chart 1 for the time period 1978-2022. Here there is a negative trend of 0.386 "pressure units" per century.
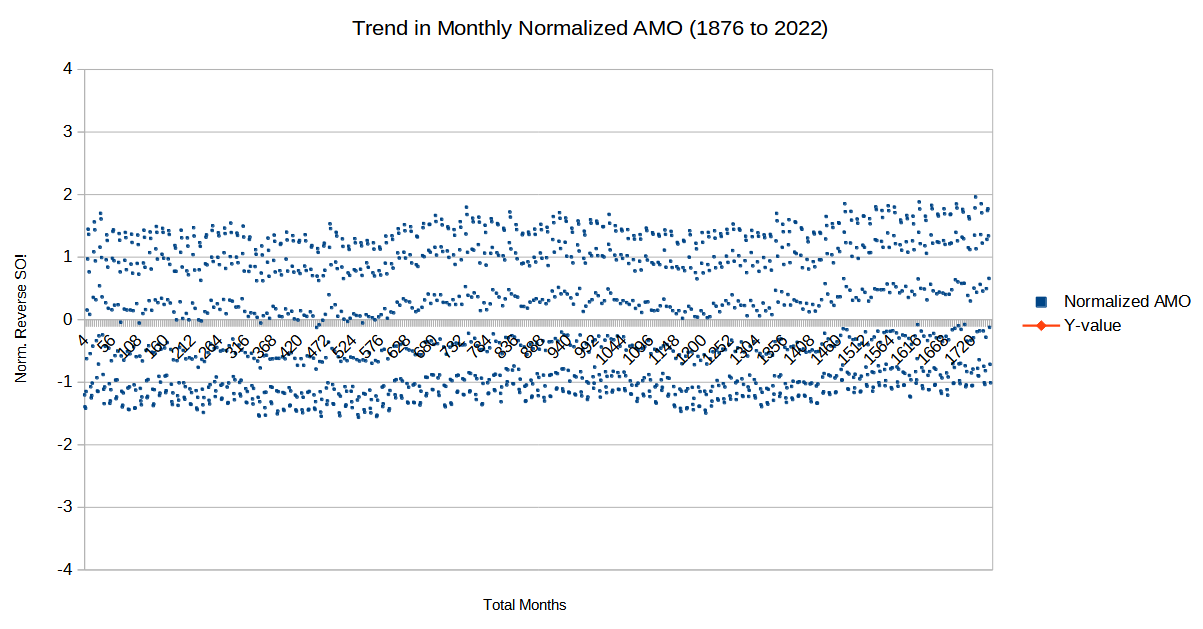
Chart 4 is a preview of a similar analysis on normalized AMO data since 1876. This will be followed up on as I complete it. It surprised me as it seems to have self-segregated itself into what initially appear to be seasonal(?) trend streams, with embedded cycles across the streams. More on this shortly.
    |
|
|
|
Post by Sigurdur on Jul 27, 2022 1:53:51 GMT
|
|
|
|
Post by ratty on Aug 20, 2022 3:35:22 GMT
|
|
|
|
Post by douglavers on Aug 20, 2022 12:50:24 GMT
It might be a little embarrassing to the Nobel Committee if our planet now cools significantly.
Perhaps the Committee will issue another prize to whoever explains why the earlier Nobel was a little erroneous, if the cooling happens?
|
|
|
|
Post by duwayne on Oct 11, 2022 19:49:03 GMT
It's been more than 15 years since I began to make global warming projections, and in the beginning and ever since I have been looking for a good explanation of why the AMO oscillates as it has done. Below is a link to a recent paper on the subject. It's like the others I have read. There really isn't much convincing evidence about what causes the AMO to oscillate and this paper like the others provides little insight into why the AMO might be running warm versus what one might expect if there really is a regular oscillation.
|
|
|
|
Post by ratty on Oct 12, 2022 0:08:36 GMT
It's been more than 15 years since I began to make global warming projections, and in the beginning and ever since I have been looking for a good explanation of why the AMO oscillates as it has done. Below is a link to a recent paper on the subject. It's like the others I have read. There really isn't much convincing evidence about what causes the AMO to oscillate and this paper like the others provides little insight into why the AMO might be running warm versus what one might expect if there really is a regular oscillation.
It seems there is a lot of unacknowledged uncertainty in many areas of climate science.  |
|
|
|
Post by missouriboy on Oct 12, 2022 0:43:06 GMT
It's been more than 15 years since I began to make global warming projections, and in the beginning and ever since I have been looking for a good explanation of why the AMO oscillates as it has done. Below is a link to a recent paper on the subject. It's like the others I have read. There really isn't much convincing evidence about what causes the AMO to oscillate and this paper like the others provides little insight into why the AMO might be running warm versus what one might expect if there really is a regular oscillation.
It seems there is a lot of unacknowledged uncertainty in many areas of climate science.  Too many Dorks Manning the models. |
|
|
|
Post by ratty on Oct 12, 2022 0:50:18 GMT
It seems there is a lot of unacknowledged uncertainty in many areas of climate science.  Too many Dorks Manning the models. Local public radio (ABC) is making much of predictions of a 74% chance of more cyclones in the coming season .... despite the BoM's own figures showing a marked downward trend in numbers and severity over an extended period: 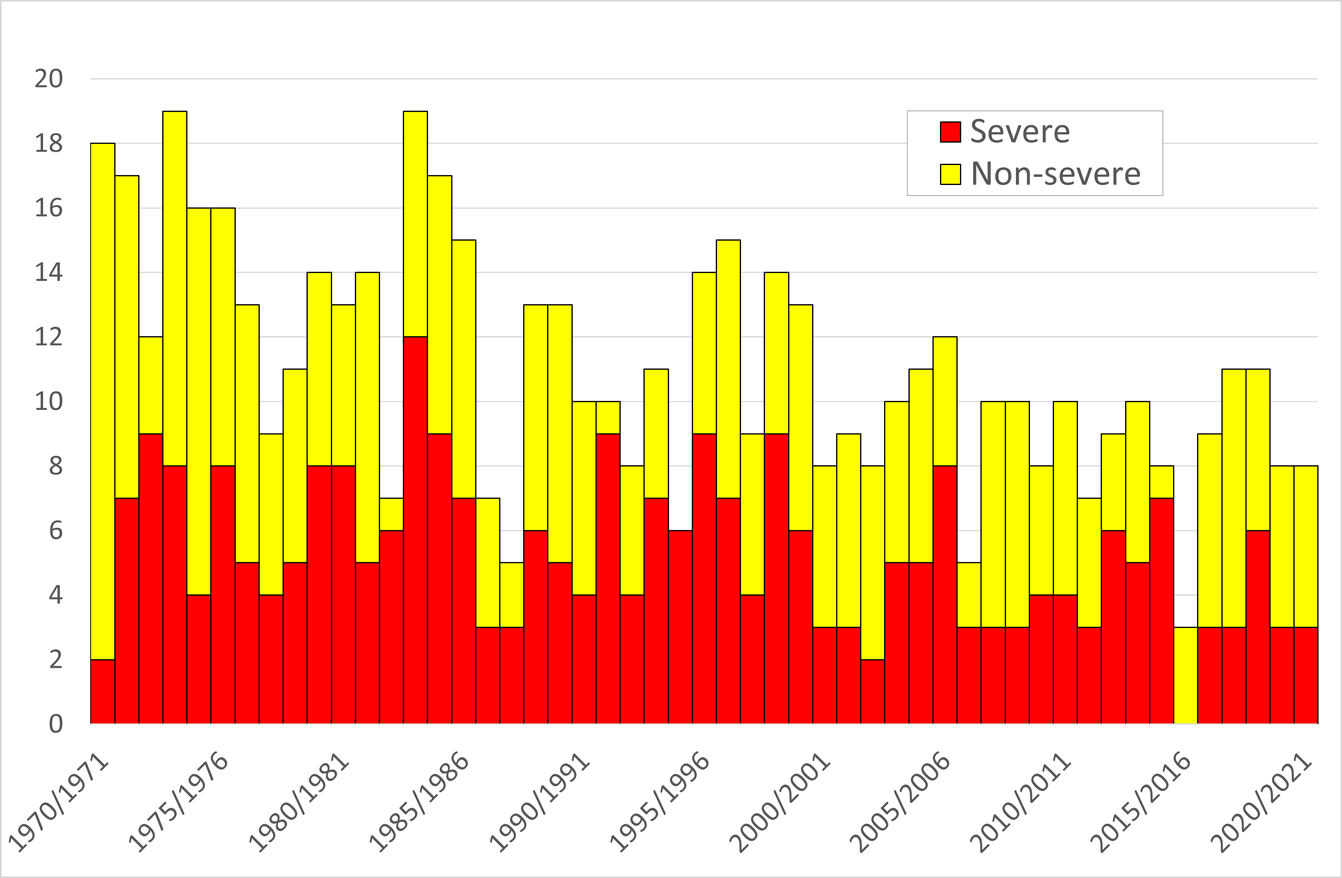 |
|