|
|
Post by missouriboy on May 12, 2024 13:19:08 GMT
Meanwhile, economies are being trashed. I see your point. From where I'm sitting everything is getting trashed 🤷♂️ We see it too. Will be "interesting" to watch the Democrats get eaten alive by repercusions from the wave(s) of Huns that they have personally invited into parts of the Country ... and have attempted to outdo each other in providing freebees. Locals aren't stupid. They can see who's getting "the Goodies". and who's not. The Treasury is empty. And there is not enough to satisfy the mobs. |
|
|
|
Post by neilhamp on May 27, 2024 6:53:21 GMT
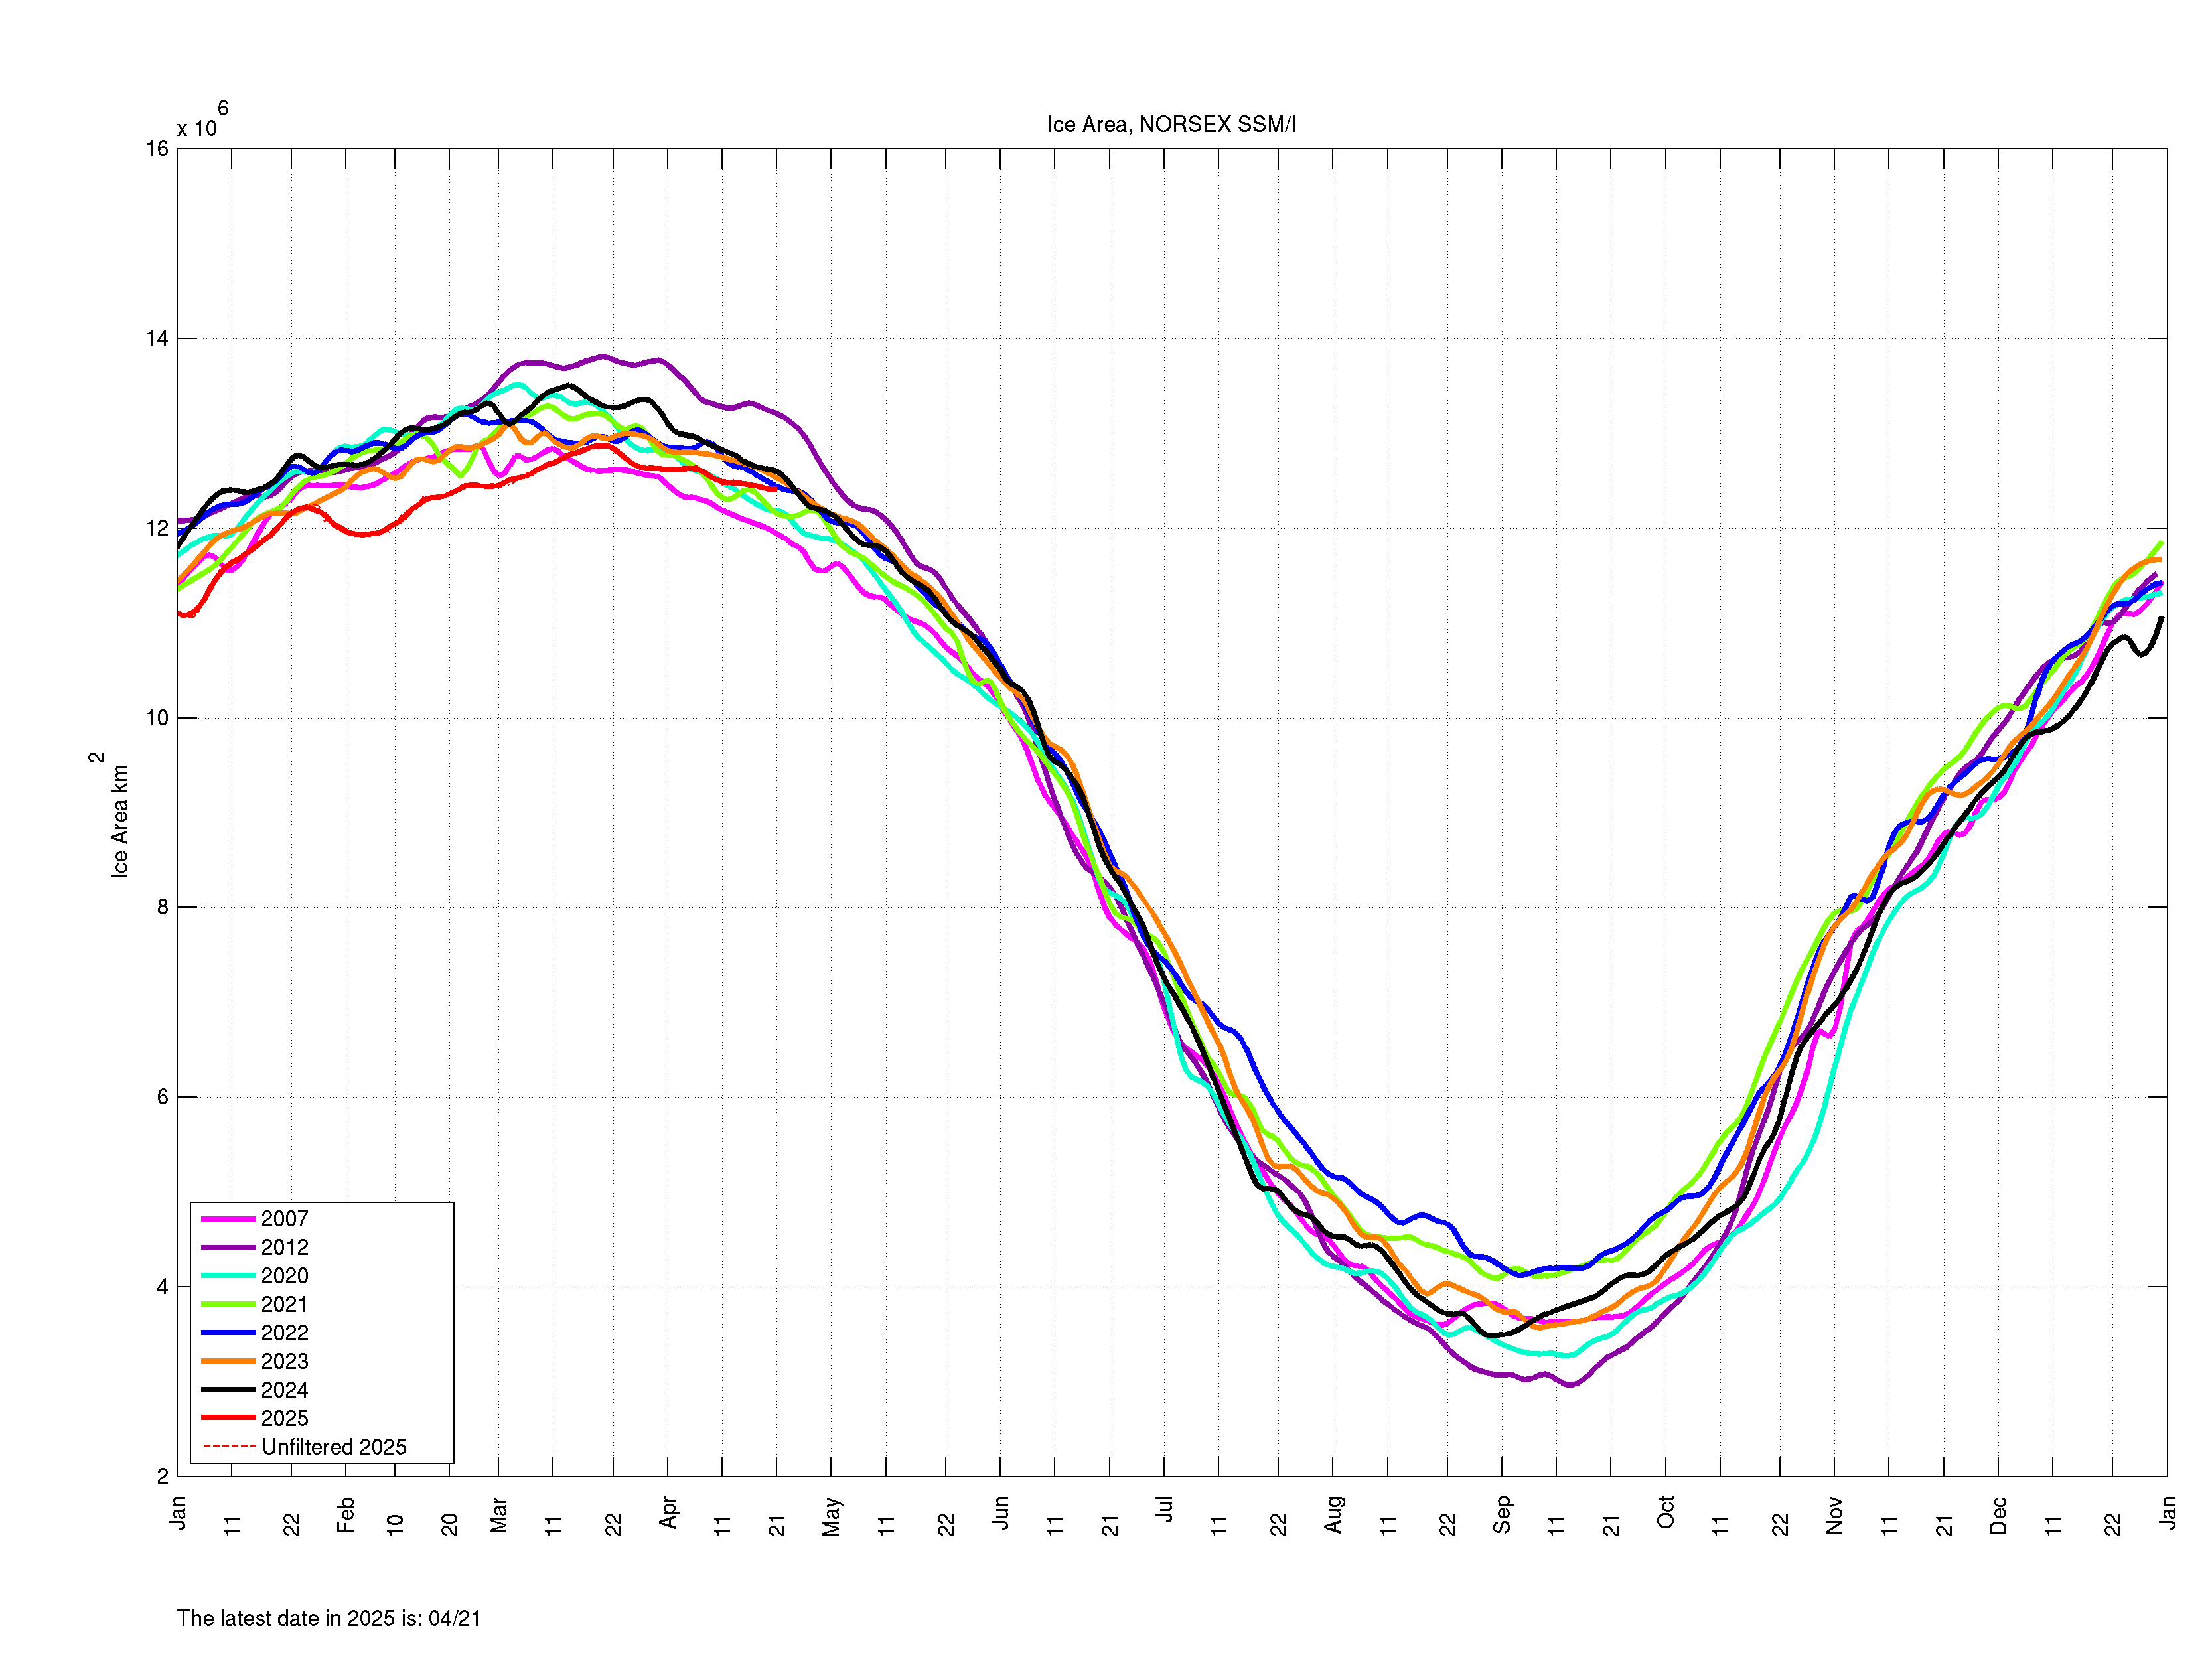
May 25, 2024. JAXA sea ice extent is at 11.56 M km², a daily loss of 0.04 M km². This loss rate is comparable to the loss rates of the 2010s (0.06 M km²), 2000s (0.05 M km²), the 1990s (0.03 M km²) and the 1980s (0.04 M km²). 2024 is at # 12 (# 1 = lowest) in the list. 2024 is 0.16 M km² above the 2010s average. May 26, 2024. JAXA sea ice extent is at 11.53 M km², a daily loss of 0.03 M km². This loss rate is lower than the loss rates of the 2010s, 2000s, the 1990s and the 1980s (each at 0.04 M km²). 2024 is at # 12 (# 1 = lowest) in the list. 2024 is 0.17 M km² above the 2010s average. link Go Down |
|
|
|
Post by ratty on May 27, 2024 7:43:09 GMT
May 25, 2024. JAXA sea ice extent is at 11.56 M km², a daily loss of 0.04 M km². This loss rate is comparable to the loss rates of the 2010s (0.06 M km²), 2000s (0.05 M km²), the 1990s (0.03 M km²) and the 1980s (0.04 M km²). 2024 is at # 12 (# 1 = lowest) in the list. 2024 is 0.16 M km² above the 2010s average. May 26, 2024. JAXA sea ice extent is at 11.53 M km², a daily loss of 0.03 M km². This loss rate is lower than the loss rates of the 2010s, 2000s, the 1990s and the 1980s (each at 0.04 M km²). 2024 is at # 12 (# 1 = lowest) in the list. 2024 is 0.17 M km² above the 2010s average. link Go Down I like the look of this graph better ..... no obvious boiling.   |
|
|
|
Post by Sigurdur on Jun 4, 2024 23:41:49 GMT
|
|
|
|
Post by neilhamp on Jul 9, 2024 6:38:05 GMT
For the past 32 months two thirds of the month end sea ice extents have been above the 2010's average  The September 15th. sea ice extent (red) is 287K LESS THAN the 2010 mean sea ice extent (yellow) Have we reached the September minimum? Has it started to turn?  |
|
|
|
Post by blustnmtn on Aug 24, 2024 17:10:39 GMT
|
|
|
|
Post by gridley on Aug 25, 2024 11:19:10 GMT
To be fair to the .gov, the question isn't "is our icebreaker fleet bigger that the other guys" it is "is our icebreaker fleet big enough for us?" The US is blessed with an abundance of ports which are ice-free year round, even more with limited approaches that ice over regularly, and we don't have anything like the NW passage to try to keep clear.
The icebreaker fleets of Canada and Russia, for example, SHOULD both dwarf ours.
|
|
|
|
Post by ratty on Sept 6, 2024 22:20:27 GMT
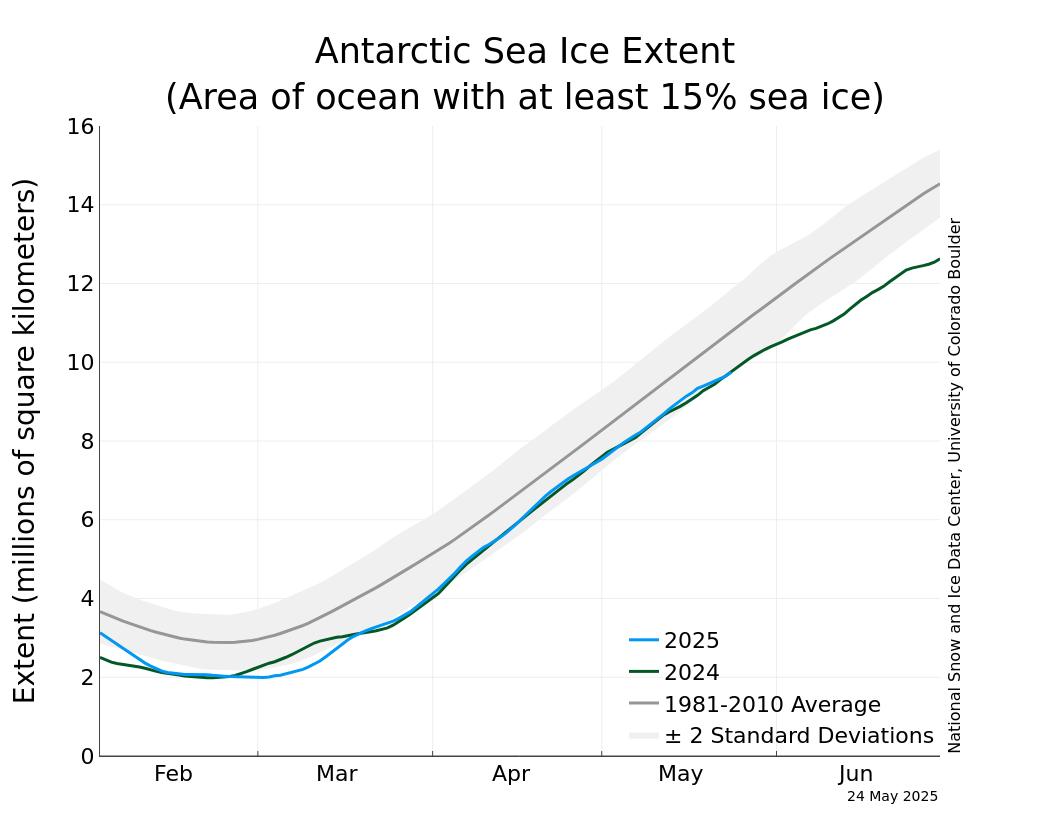
A Tale of two Charts ....   |
|