|
|
Post by missouriboy on Jun 27, 2023 12:24:23 GMT
He gets graded down for a couple of points of logic and fact. The arctic does not warm (melt) from the top down. It warms (melts) from the bottom up. See Dilley. The macro-gravitational wave that directs pulses of ocean water is changing direction, and the cooling will return. |
|
|
|
Post by ratty on Jun 27, 2023 23:50:30 GMT
He gets graded down for a couple of points of logic and fact. The arctic does not warm (melt) from the top down. It warms (melts) from the bottom up. See Dilley. The macro-gravitational wave that directs pulses of ocean water is changing direction, and the cooling will return. I meant to highlight Logic and History but forgot.  |
|
|
|
Post by neilhamp on Jul 1, 2023 5:47:28 GMT
2022Jan.31.—-16th.lowest. +333,064 sq.km. above 2010’s average. Feb.28.—-11th.lowest +116,764 sq.km. above 2010’s average Mar.31.—-10th.lowest -127,470 sq.km. BELOW 2010’s average Apr. 30.—-14th.lowest +16,886 sq.km. above 2010’s average May. 31.—15th lowest +395,097 sq.km. above 2010’s average Jun. 30-10th.lowest +35,744 sq.km above 2010’s averageJul. 31.—–12th lowest +228,905 sq.km. above 2010’s average Aug.31.—-11th.lowest +203,902 sq.km. above 2010’s average Sep.30.—-–7th lowest +115,918 sq.km. above 2010’s average Oct.31.-- 11th lowest, +269,119 sq.km. above 2010’s average Nov30.——5th lowest, -183,803 sq.km. BELOW 2010’s average Dec.31-----4th.lowest,-138,700 sq.km. BELOW 2010's average 2023Jan.31----2nd.lowest, -302,000 sq.km. BELOW 2010's average Feb.28------9th.lowest, -36,000 sq.km. BELOW 2010's average Mar.31-----7th.lowest, -274,000 sq.km. BELOW 2010's average Apr.30-----11th.lowest, +50,500 sq.km. above 2010's average May 31---11th.lowest, +103,000 sq.km. above 2010's average Jun.30--11th.lowest, +81,754 sq.km. above 2010's averageJul.31 ---13th. lowest, +244,585 sq.km. above 2010's average Aug.31-----7th.lowest, -86,000 sq.km. BELOW 2010's average Last year, the June sea ice extent fell dramatically in June. This year, the June sea ice extent has remained well above the 2010's average. At month end June 2023 was 81,754-35,744 = 46,010 sq.km. higher than June 2022 Sea Ice Extent dropped BELOW 2010's average  Meanwhile, lets not forget, down in the Antarctic things not looking good 
|
|
|
|
Post by neilhamp on Jul 2, 2023 6:31:47 GMT
BTW Can I make these images smaller?
Thanks Moboy.
That was so quick and easy.
It has been troubling me for months.
|
|
|
|
Post by missouriboy on Jul 2, 2023 15:48:27 GMT
BTW Can I make these images smaller? Hit the Edit button. Click on BBcode at the bottom. Note the line defining your image has a size section (ex. style="max-width:100%  . Change 100% to something else like 50%. |
|
|
|
Post by douglavers on Jul 8, 2023 3:50:42 GMT
www.ventusky.com/?p=76;-42;2&l=snowGoing back to one of my themes, according to DMO, quite a lot of melting is now happening in Greenland. However, when I look at temperatures and snow cover on the ventusky site, this not obvious. Someone telling porkies? Sadly, almost total snow cover [still] means that most land based mammals will starve next winter. Not enough growing season left.
|
|
|
|
Post by neilhamp on Jul 29, 2023 7:01:46 GMT
DMI shows ice accumulation for 2023 is just above normal polarportal.dk/en/greenland/surface-conditions/I have tried to copy the image but for some reason I am not able to do so Click on ACC for accumulation of ice in 2023 I am not an expert, but as I understand it - Accumulation = New snowfall - melting ice If you click on melt you will see the ice melt rate for 2023 is unusually high (They are not telling porkies) As you point out, Doug, the new snowfall must also be high so the overall accumulation is just above normal |
|
|
|
Post by neilhamp on Aug 2, 2023 6:26:49 GMT
Work on Artic spring revisited
tallbloke.wordpress.com/2023/07/30/earlier-and-earlier-high-arctic-spring-replaced-by-extreme-year-to-year-variation-say-researchers/About 15 years ago, researchers reported that the timing of spring in high-Arctic Greenland had advanced at some of the fastest rates of change ever seen anywhere in the world.But, according to new evidence, that earlier pattern has since been completely erased. Instead of coming earlier and earlier, it seems the timing of Arctic spring is now driven by tremendous climate variability with drastic differences from one year to the next. “ As scientists we are obliged to revisit previous work to see whether the knowledge obtained at that time still holds,” says Niels Martin Schmidt of Aarhus University in Denmark. “We looked at previously reported extreme rates of phenological advancements in the Arctic and found that directional advancement is no longer the prevailing pattern. Actually, the previously observed trend has disappeared completely and has been replaced by extreme year-to-year variation in the onset of spring.” Please Note. Artic data above will be updated through August
|
|
|
|
Post by blustnmtn on Aug 2, 2023 12:22:17 GMT
Work on Artic spring revisited
tallbloke.wordpress.com/2023/07/30/earlier-and-earlier-high-arctic-spring-replaced-by-extreme-year-to-year-variation-say-researchers/About 15 years ago, researchers reported that the timing of spring in high-Arctic Greenland had advanced at some of the fastest rates of change ever seen anywhere in the world.But, according to new evidence, that earlier pattern has since been completely erased. Instead of coming earlier and earlier, it seems the timing of Arctic spring is now driven by tremendous climate variability with drastic differences from one year to the next. “ As scientists we are obliged to revisit previous work to see whether the knowledge obtained at that time still holds,” says Niels Martin Schmidt of Aarhus University in Denmark. “We looked at previously reported extreme rates of phenological advancements in the Arctic and found that directional advancement is no longer the prevailing pattern. Actually, the previously observed trend has disappeared completely and has been replaced by extreme year-to-year variation in the onset of spring.” Please Note. Artic data above will be updated through August That's certainly an odd, standout report to see in today's news. I seemed to have missed it in MSM's in depth reportage  |
|
|
|
Post by acidohm on Sept 1, 2023 16:53:11 GMT
|
|
|
|
Post by neilhamp on Sept 4, 2023 6:22:08 GMT
2022Jan.31.—-16th.lowest. +333,064 sq.km. above 2010’s average. Feb.28.—-11th.lowest +116,764 sq.km. above 2010’s average Mar.31.—-10th.lowest -127,470 sq.km. BELOW 2010’s average Apr. 30.—-14th.lowest +16,886 sq.km. above 2010’s average May. 31.—15th lowest +395,097 sq.km. above 2010’s average Jun. 30-10th.lowest +35,744 sq.km above 2010’s average Jul. 31.—–12th lowest +228,905 sq.km. above 2010’s average Aug.31.—-11th.lowest +203,902 sq.km. above 2010’s average Sep.30.—-–7th lowest +115,918 sq.km. above 2010’s averageOct.31.-- 11th lowest, +269,119 sq.km. above 2010’s average Nov30.——5th lowest, -183,803 sq.km. BELOW 2010’s average Dec.31-----4th.lowest,-138,700 sq.km. BELOW 2010's average 2023Jan.31----2nd.lowest, -302,000 sq.km. BELOW 2010's average Feb.28------9th.lowest, -36,000 sq.km. BELOW 2010's average Mar.31-----7th.lowest, -274,000 sq.km. BELOW 2010's average Apr.30-----11th.lowest, +50,500 sq.km. above 2010's average May 31---11th.lowest, +103,000 sq.km. above 2010's average Jun.30-----11th.lowest, +81,754 sq.km. above 2010's average Jul.31 ---13th. lowest, +244,585 sq.km. above 2010's average Aug.31-------7th.lowest, -84,717 sq.km. BELOW 2010's average Sep.30---5th.lowest, -397,681 sq.km. BELOW 2010's average
Oct.18 -----8th.lowest, -112,000 sq.km. BELOW 2010's average September minimum is well BELOW the 2010's average this year. October recovery progressing towards 2010's average. 
|
|
|
|
Post by ratty on Sept 4, 2023 6:45:33 GMT
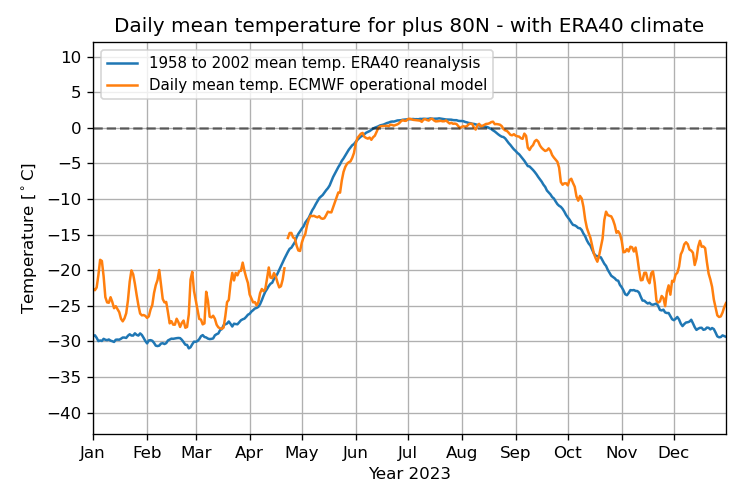
[ Snip ] Arctic temperatures slow to drop below zero this year!  Hunga Tonga–Hunga Haʻapai? |
|
|
|
Post by neilhamp on Sept 18, 2023 7:13:25 GMT
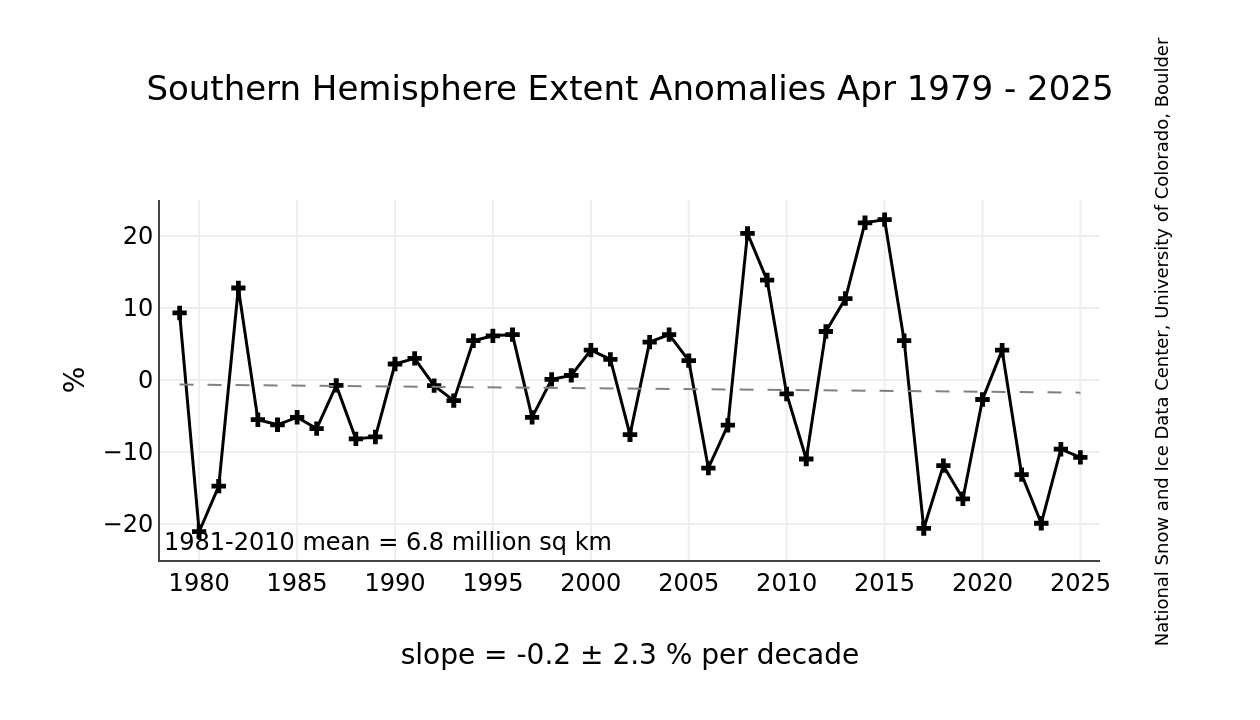
British media claiming major "new" evidence of sea ice decline in Antarctic. They attribute the drop in sea ice to "the climate crisis" Sea ice in antarctica has grown consistently from 1979 to 2021. As Ratty points out, Hunga Tonga–Hunga Haʻapai occurred in January 2022. The sudden drop in winter sea ice occurred in August, later that year. It has continued in 2023. Hunga Tonga was big. How might it have changed conditions in the Antarctic ocean?  |
|
|
|
Post by nonentropic on Sept 18, 2023 7:21:18 GMT
beware of the AMO switching I say.
|
|
|
|
Post by neilhamp on Sept 18, 2023 7:31:19 GMT
I've been waiting for the AMO drop myself, nonentropic.
Trouble is no data is available since January 2023.
Does anyone know when we will see AMO data start?
|
|