|
|
Post by missouriboy on Apr 17, 2023 0:01:45 GMT
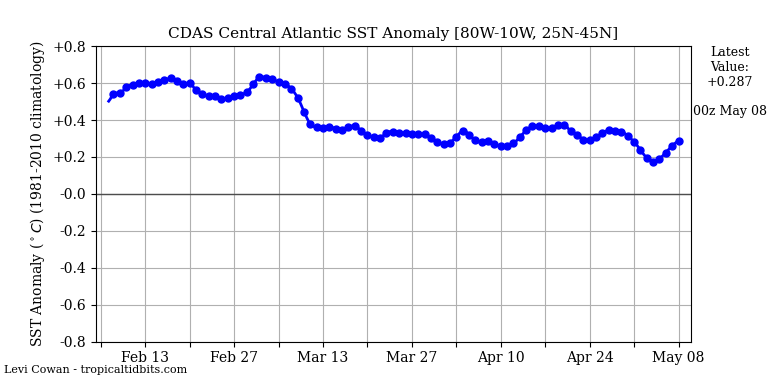
duwayne, I too am looking for update of AMO data. Don't know what is causing the delay.Bad News?   |
|
|
|
Post by ratty on Apr 17, 2023 0:52:44 GMT
duwayne, I too am looking for update of AMO data. Don't know what is causing the delay.Bad News?   Data to be manipulated? |
|
|
|
Post by nonentropic on Apr 17, 2023 3:02:39 GMT
I hate wiggle watching, but have to say I do a bit of it regardless.
The temperature of earth has some impact on sea ice extent but actually wind direction and strength are far more important, by way of example the 15% sea ice extent above is 85% open water so a reduction in extent of 50% could be only a consequence of wind direct ie toward an obstacle or away.
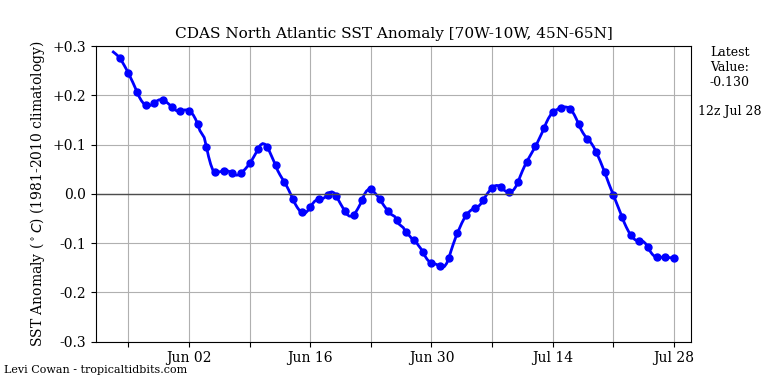
The whole issue is that the AMO is sluggishly reversing that will drive a reduction in Antarctic sea ice and a lift in Arctic sea ice. Which will take center stage then.
The most disgraceful issue is the total lack of discussion about the cool southern oceans and the cool temperatures in the Antarctic for the past 3 decades, that speak volumes about the likely extent of the natural variations even if there is a AGW component at some level. Charney was not a fool.
|
|
|
|
Post by walnut on Apr 17, 2023 4:28:58 GMT
I hate wiggle watching, but have to say I do a bit of it regardless. The temperature of earth has some impact on sea ice extent but actually wind direction and strength are far more important, by way of example the 15% sea ice extent above is 85% open water so a reduction in extent of 50% could be only a consequence of wind direct ie toward an obstacle or away. The whole issue is that the AMO is sluggishly reversing that will drive a reduction in Antarctic sea ice and a lift in Arctic sea ice. Which will take center stage then. The most disgraceful issue is the total lack of discussion about the cool southern oceans and the cool temperatures in the Antarctic for the past 3 decades, that speak volumes about the likely extent of the natural variations even if there is a AGW component at some level. Charney was not a fool. I have finally noticed lately a couple of headlines about Antarctica, but I didn't save or bookmark them. |
|
|
|
Post by ratty on Apr 17, 2023 4:38:16 GMT
I hate wiggle watching, but have to say I do a bit of it regardless. The temperature of earth has some impact on sea ice extent but actually wind direction and strength are far more important, by way of example the 15% sea ice extent above is 85% open water so a reduction in extent of 50% could be only a consequence of wind direct ie toward an obstacle or away. The whole issue is that the AMO is sluggishly reversing that will drive a reduction in Antarctic sea ice and a lift in Arctic sea ice. Which will take center stage then. The most disgraceful issue is the total lack of discussion about the cool southern oceans and the cool temperatures in the Antarctic for the past 3 decades, that speak volumes about the likely extent of the natural variations even if there is a AGW component at some level. Charney was not a fool. I have finally noticed lately a couple of headlines about Antarctica, but I didn't save or bookmark them. It's about time to have another go at the WAIS; this from 2020: How close is the West Antarctic ice sheet to a ‘tipping point’? |
|
|
|
Post by neilhamp on Apr 28, 2023 6:05:26 GMT
November month end sea ice extent fell BELOW 2010’s average for the first time since March 2022. It remained BELOW 2010's average until April 2023 Jan.31.—-16th.lowest. +333,064 sq.km. above 2010’s average. Feb.28.—-11th.lowest +116,764 sq.km. above 2010’s average Mar.31.—-10th.lowest -127,470 sq.km. BELOW 2010’s average Apr. 30.—-14th.lowest +16,886 sq.km. above 2010’s average May. 31.—15th lowest +395,097 sq.km. above 2010’s average Jun. 30.—--10th.lowest +35,744 sq.km above 2010’s average Jul. 31.—–12th lowest +228,905 sq.km. above 2010’s average Aug.31.—-11th.lowest +203,902 sq.km. above 2010’s average Sep.30.—-–7th lowest +115,918 sq.km. above 2010’s average Oct.31.-- 11th lowest, +269,119 sq.km. above 2010’s average Nov30.——5th lowest, -183,803 sq.km. BELOW 2010’s average Dec.31-----4th.lowest,-138,700 sq.km. BELOW 2010's average Jan.31----2nd.lowest, -302,000 sq.km. BELOW 2010's average Feb.28------9th.lowest, -36,000 sq.km. BELOW 2010's average Mar.31-----7th.lowest, -274,000 sq.km. BELOW 2010's average Apr.30-----11th.lowest, +50,500 sq.km. above 2010's average May 31----11th.lowest, +124,000 sq.km. above 2010's average Month end April sea ice has just risen above 2010's average. May sea ice extent remains above 2010's average but significantly lower than 2022.  |
|
|
|
Post by neilhamp on Jun 10, 2023 6:18:06 GMT
November 2022 month end sea ice extent fell BELOW 2010’s average for the first time since March 2022. It remained BELOW 2010's average until April 2023 2022Jan.31.—-16th.lowest. +333,064 sq.km. above 2010’s average. Feb.28.—-11th.lowest +116,764 sq.km. above 2010’s average Mar.31.—-10th.lowest -127,470 sq.km. BELOW 2010’s average Apr. 30.—-14th.lowest +16,886 sq.km. above 2010’s average May. 31.—15th lowest +395,097 sq.km. above 2010’s average Jun. 30.-10th.lowest +35,744 sq.km above 2010’s average Jul. 31.—–12th lowest +228,905 sq.km. above 2010’s average Aug.31.—-11th.lowest +203,902 sq.km. above 2010’s average Sep.30.—-–7th lowest +115,918 sq.km. above 2010’s average Oct.31.-- 11th lowest, +269,119 sq.km. above 2010’s average Nov30.——5th lowest, -183,803 sq.km. BELOW 2010’s average Dec.31-----4th.lowest,-138,700 sq.km. BELOW 2010's average 2023Jan.31----2nd.lowest, -302,000 sq.km. BELOW 2010's average Feb.28------9th.lowest, -36,000 sq.km. BELOW 2010's average Mar.31-----7th.lowest, -274,000 sq.km. BELOW 2010's average Apr.30-----11th.lowest, +50,500 sq.km. above 2010's average May 31---11th.lowest, +103,000 sq.km. above 2010's average June 30 11th.lowest, +81,754 sq.km. above 2010's average Last year, the June sea ice extent fell dramatically in June. This year, the June sea ice extent has remained well above the 2010's average. The June 2023 sea ice extent was greater than all the years since 2010, except 2015 and 2018.  |
|
|
|
Post by blustnmtn on Jun 20, 2023 14:34:44 GMT
|
|
|
|
Post by neilhamp on Jun 22, 2023 6:41:43 GMT
|
|
|
|
Post by youngjasper on Jun 26, 2023 1:10:53 GMT
Interesting. The world is not linear and true (un-adjusted) historical date shows that. It is cyclical. Arctic Sea Ice Extent is still channeling between the average of the 2000s and 2010s. Source: ads.nipr.ac.jp/vishop/#/extent
Not wiggle watching, but watching.
|
|
|
|
Post by nonentropic on Jun 26, 2023 2:13:46 GMT
Lets all come clean we wiggle watch!
|
|
|
|
Post by ratty on Jun 26, 2023 7:45:39 GMT
Lets all come clean we wiggle watch! Thank you MOBoy, wiggle creator in chief!  |
|
|
|
Post by missouriboy on Jun 26, 2023 13:51:37 GMT
Wiggles are fun. If you watch them long enough, they morph into bigger (nested) wiggles. By definition, a wiggle incorporates an up and down phase. The trick is to figure out when they change their macro-direction. The Great Climate Shift of ~1976 was an energy-macro-wiggle change. What we are seeing today seems to be a reversal of the hemisphere of concentration. As ENSO and the PDO collapse into cold, the equatorial western heat is congregating further south. Interesting that this shift seems to be providing OZ with a colder winter. From an interest perspective, we are lucky that these macro-wiggles are coming together in our life time.
|
|
|
|
Post by missouriboy on Jun 26, 2023 14:06:34 GMT
If you are not brain-dead, and are an observer of other natural "cycles" in our world, then this is a paradigm changer. And you will never again listen to linearistas. This graph is an important visual tool in that conversion. Others can do the same. I see a tee-shirt in this graph's future. I wonder if he'd mind. The Celts of Brittany might be interested.  As I read in "the Ballad of Ecological Awareness" back in the 1960s ... "No relationship in the World is linear for long". That would make a great caption for that tee-shirt. Thank you Neil. |
|
|
|
Post by ratty on Jun 27, 2023 6:19:18 GMT
|
|