|
|
Post by missouriboy on Jan 5, 2023 22:45:56 GMT
"Surrendering to the increasingly obvious (at least in part) would be good for [Michael Mann's] character." Michael Mann and character together in one sentence?  Typo? There is always hope. Repentance Now.  |
|
|
|
Post by ratty on Jan 6, 2023 22:53:55 GMT
"Surrendering to the increasingly obvious (at least in part) would be good for [Michael Mann's] character." Michael Mann and character together in one sentence?  Typo? There is always hope. Repentance Now.  Two 'F' words come to mind: faint and forlorn. |
|
|
|
Post by acidohm on Jan 6, 2023 23:22:36 GMT
Just a thought... This guy relates a war experience. BBC: Harry has turned against military, says ex-commander. www.bbc.co.uk/news/uk-64185176Bare in mind he did nothing without at least one, probably more, aircraft stuffed with SAS following him. Valuable assets put in harms way/removed from other duties, to allow him to perform his duties. Petulance. |
|
|
|
Post by missouriboy on Jan 7, 2023 2:42:01 GMT
Just a thought... This guy relates a war experience. BBC: Harry has turned against military, says ex-commander. www.bbc.co.uk/news/uk-64185176Bare in mind he did nothing without at least one, probably more, aircraft stuffed with SAS following him. Valuable assets put in harms way/removed from other duties, to allow him to perform his duties. Petulance. Petulance is a good term. He is headed for an unpleasant life. The trophy husband of an unpleasant woman. Bringing home the money until he can't. For some reason I had a flashback to the Rock Hudson movie "Seconds". The full movie is here. ok.ru/video/391394495216 |
|
|
|
Post by neilhamp on Jan 15, 2023 7:14:05 GMT
Continuing to update sea ice extent for January on page 16
|
|
|
|
Post by neilhamp on Feb 6, 2023 5:05:46 GMT
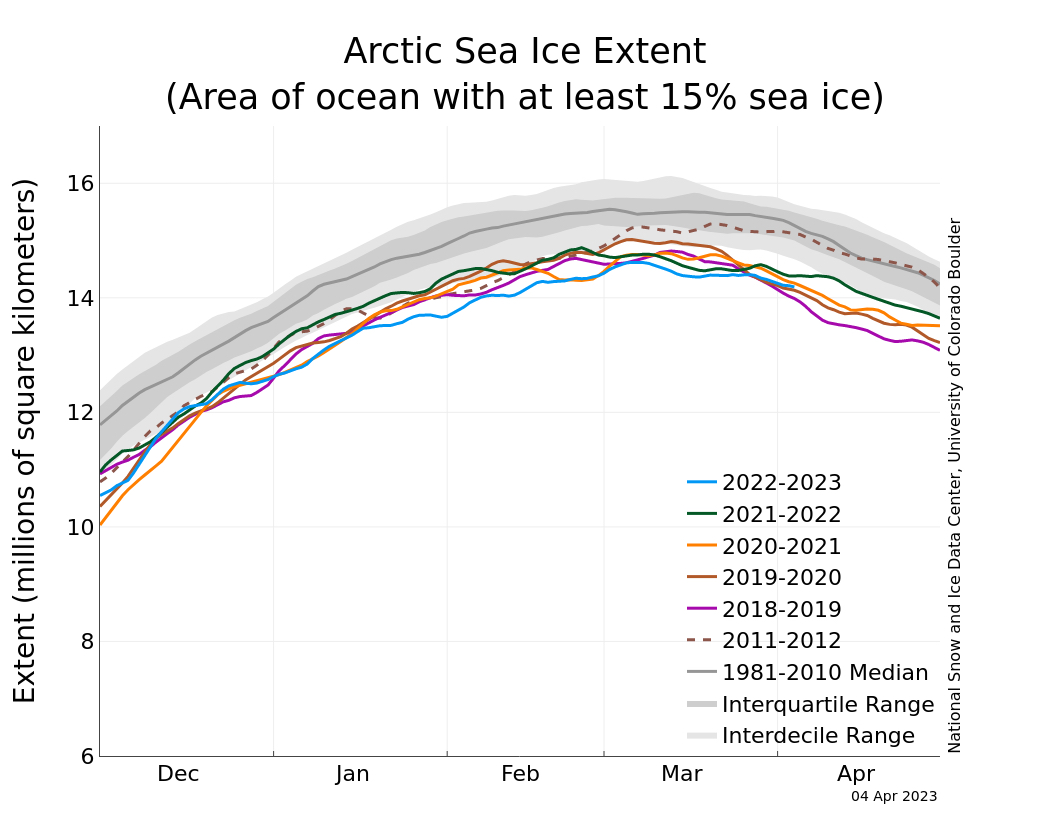
November month end sea ice extent fell BELOW 2010’s average for the first time since March 2022. Jan.31.—-16th.lowest. +333,064 sq.km. above 2010’s average. Feb.28.—-11th.lowest +116,764 sq.km. above 2010’s average Mar.31.—-10th.lowest -127,470 sq.km. BELOW 2010’s average Apr. 30.—-14th.lowest +16,886 sq.km. above 2010’s average May. 31.—15th lowest +395,097 sq.km. above 2010’s average Jun. 30.—-10th.lowest +35,744 sq.km above 2010’s average Jul. 31.—–12th lowest +228,905 sq.km. above 2010’s average Aug.31.—-11th.lowest +203,902 sq.km. above 2010’s average Sep.30.—–7th lowest +115,918 sq.km. above 2010’s average Oct.31.—– 11th lowest, +269,119 sq.km. above 2010’s average Nov30.——5th lowest, -183,803 sq.km. BELOW 2010’s average Dec.31-----4th.lowest,-138,700 sq.km. BELOW 2010's average Jan.31-----2nd.lowest, -302,000 sq.km. BELOW 2010's average Feb.28------9th.lowest, -36,000 sq.km. BELOW 2010's average The improvement in sea ice this month has been slow. It has approached the 2010 average by month end. 9th lowest is a big improvement on Nov. Dec. and Jan.  J |
|
|
|
Post by Sigurdur on Feb 23, 2023 19:07:22 GMT
|
|
|
|
Post by neilhamp on Mar 5, 2023 7:14:17 GMT
November month end sea ice extent fell BELOW 2010’s average for the first time since March 2022. Jan.31.—-16th.lowest. +333,064 sq.km. above 2010’s average. Feb.28.—-11th.lowest +116,764 sq.km. above 2010’s average Mar.31.—-10th.lowest -127,470 sq.km. BELOW 2010’s average Apr. 30.—-14th.lowest +16,886 sq.km. above 2010’s average May. 31.—15th lowest +395,097 sq.km. above 2010’s average Jun. 30.—--10th.lowest +35,744 sq.km above 2010’s average Jul. 31.—–12th lowest +228,905 sq.km. above 2010’s average Aug.31.—-11th.lowest +203,902 sq.km. above 2010’s average Sep.30.—-–7th lowest +115,918 sq.km. above 2010’s average Oct.31.-- 11th lowest, +269,119 sq.km. above 2010’s average Nov30.——5th lowest, -183,803 sq.km. BELOW 2010’s average Dec.31-----4th.lowest,-138,700 sq.km. BELOW 2010's average Jan.31----2nd.lowest, -302,000 sq.km. BELOW 2010's average Feb.28------9th.lowest, -36,000 sq.km. BELOW 2010's average Mar.31-----7th.lowest, -274,000 sq.km. BELOW 2010's average Apr.22------10th.lowest, -41,000 sq.km. BELOW 2010's average April sea ice is edging closer and closer to 2010 average. Will it rise ABOVE 2010's average by month end.  |
|
|
|
Post by neilhamp on Apr 16, 2023 6:40:43 GMT
Notice that PIOMAS are also showing a pause in the decline of sea ice volume since 2010. The AMO was steadily rising since 1975. It reached its maximum about 2007. What will happen when it starts to fall?  |
|
|
|
Post by ratty on Apr 16, 2023 6:49:40 GMT
|
|
|
|
Post by duwayne on Apr 16, 2023 12:33:09 GMT
Notice that PIOMAS are also showing a pause in the decline of sea ice volume since 2010. The AMO was steadily rising since 1975. It reached its maximum about 2007. What will happen when it starts to fall?  The last monthly AMO number I've found is for January. Is there another source? |
|
|
|
Post by glennkoks on Apr 16, 2023 13:34:23 GMT
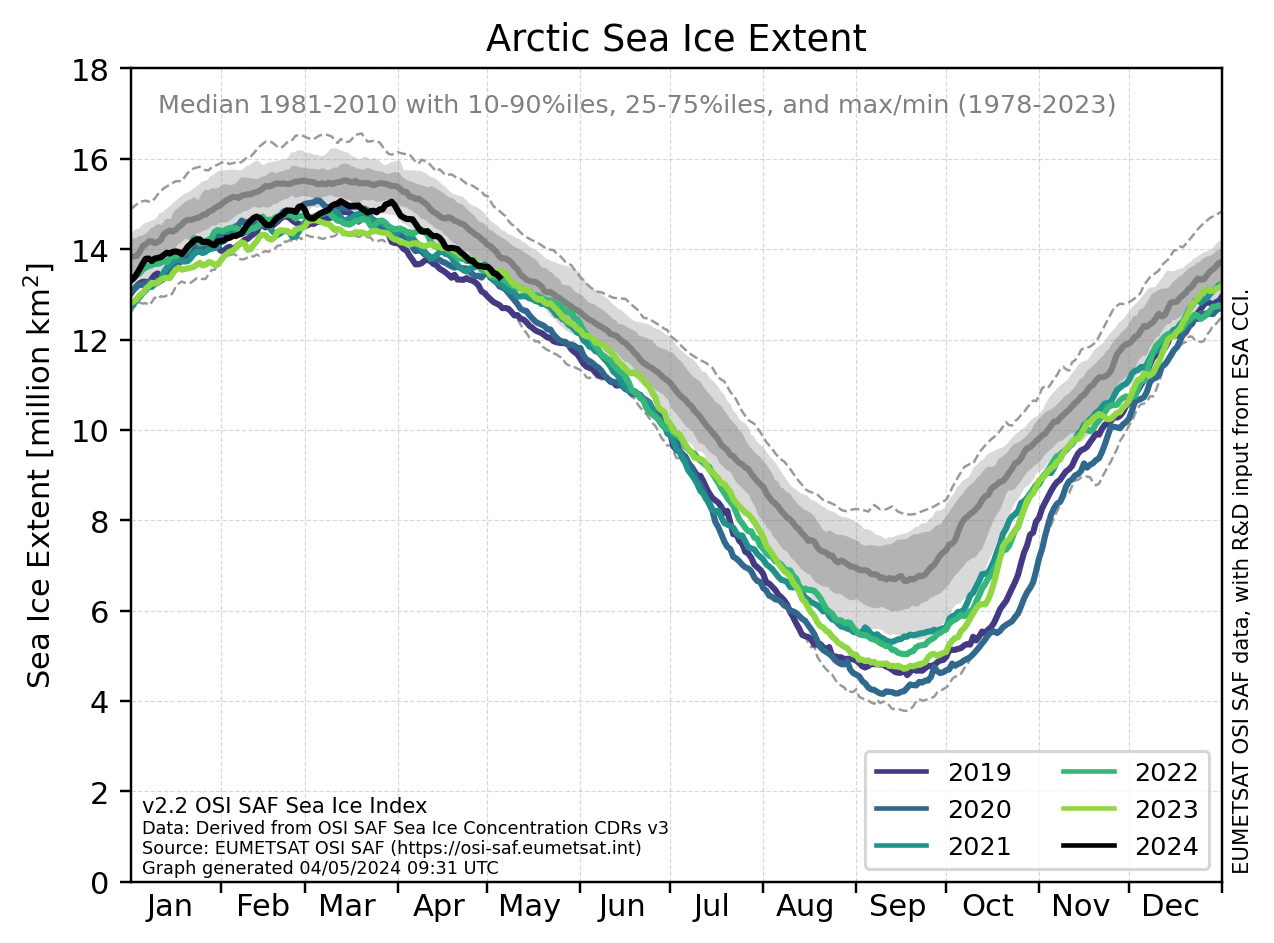
It's always bothered me that for their graphs the NSIDC only uses the median from 1980-2010. I guess it makes the ice loss look more dramatic when you leave out 12 years worth of data. nsidc.org/arcticseaicenews/ |
|
|
|
Post by missouriboy on Apr 16, 2023 13:41:42 GMT
Notice that PIOMAS are also showing a pause in the decline of sea ice volume since 2010. The AMO was steadily rising since 1975. It reached its maximum about 2007. What will happen when it starts to fall? The last monthly AMO number I've found is for January. Is there another source? Only Tropical Tidbits for N Atlantic and mid-Latitude Atlantic OR Argo if someone has access. Have never found back files for tropical tidbits. Probably stored somewhere. |
|
|
|
Post by neilhamp on Apr 16, 2023 13:46:46 GMT
duwayne,
I too am looking for update of AMO data.
Don't know what is causing the delay.
|
|
|
|
Post by ratty on Apr 16, 2023 23:10:28 GMT
It's always bothered me that for their graphs the NSIDC only uses the median from 1980-2010. I guess it makes the ice loss look more dramatic when you leave out 12 years worth of data. nsidc.org/arcticseaicenews/Compare and contrast NSIDC and DMI?   |
|