|
|
Post by Sigurdur on Aug 29, 2022 17:24:41 GMT
More of the same.
|
|
|
|
Post by missouriboy on Aug 29, 2022 19:18:41 GMT
My guesses are that heat loss is exceeding heat gain. Loss of inputs due to increasing cloud cover and very low UV. No data on wind, but heat losses due to evaporation may be up. Geomagnetic-AP values, which are a proxy for solar output, continue at historically low levels. As per Neil's forecast for Arctic sea ice, when the AMO turns, watch out. Until then, I think that it will continue it's incremental uptrend. The sound in the wind will be the gnashing of teeth.
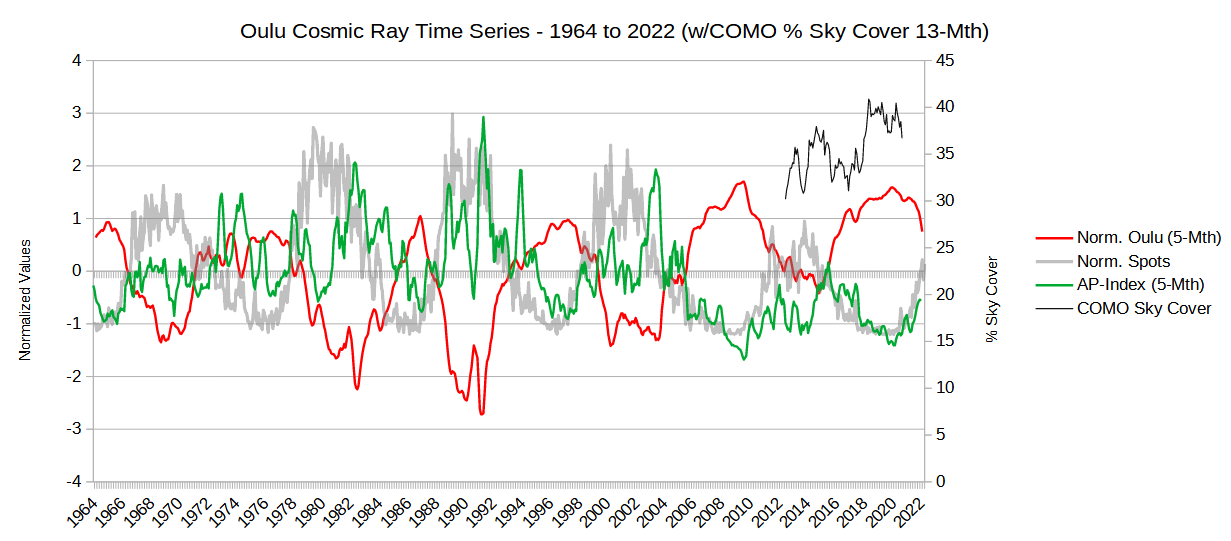
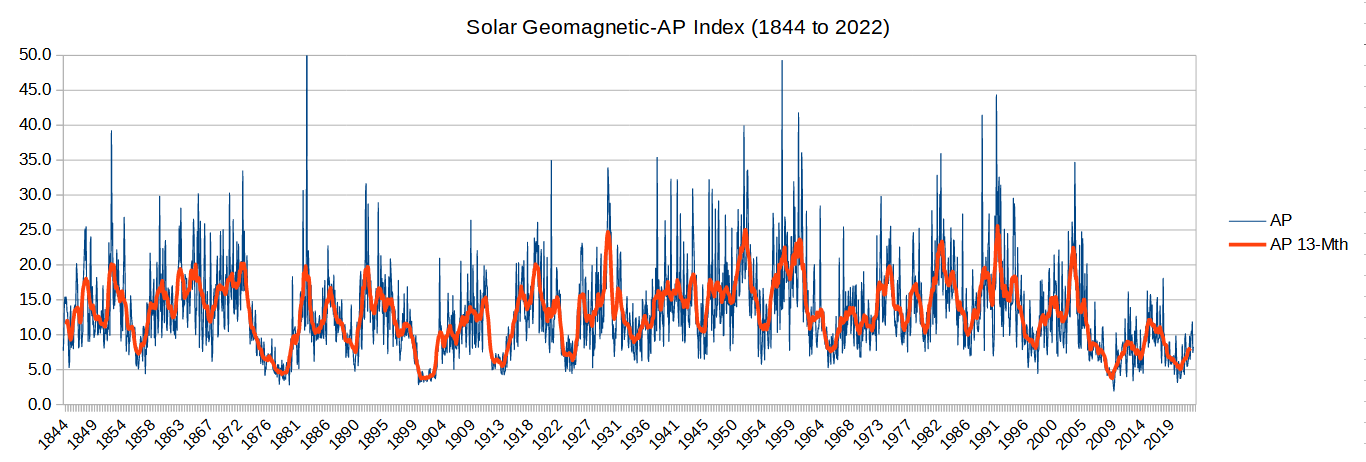 What an amazing graph. Thank you for posting. It seems to say that geomagnetic activity is at its lowest continuous level since records began. This MUST have an effect on climate, but I have no idea where to start investigating it. The only other trend I have found, which shows the same pattern, is the cosmic ray monitor from the University of Oulu, cosmicrays.oulu.fi/. Cosmic rays have been at a historic high since 2004. Why do you think the AMO is going to turn? And can you give a source for the graph, please.
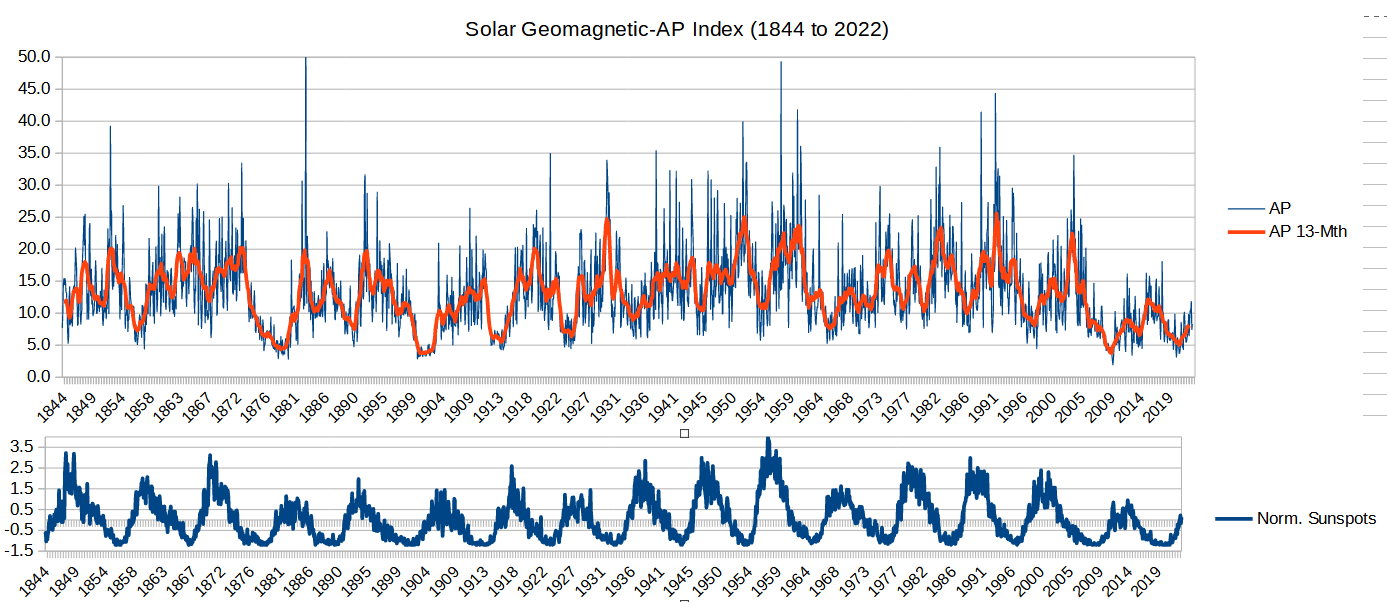
Here is another with sunpots below. Also the cosmic ray timeseries since 1964. I am going to start a "Climate-Solar Indexes" thread where I can park all the different dataset charts.
And I expect the AMO to turn because it has semi-regularly turned before. Not the greatest science, but ...
  |
|
|
|
Post by Jane in the centre of England on Aug 31, 2022 9:03:48 GMT
Fascinating stuff! What is COMO sky cover? I ecosia'ed it & got some sites for upholstery and lampshades.
|
|
|
|
Post by missouriboy on Aug 31, 2022 15:24:53 GMT
Fascinating stuff! What is COMO sky cover? I ecosia'ed it & got some sites for upholstery and lampshades. Sorry.  That is the local Code for COlumbia, MissOuri ... my location. I had been tracking sky cover from the National Weather Service data files, as a proxy for cloud cover, until they stopped reporting them. Tracks nicely with cosmic rays huh? |
|
|
|
Post by neilhamp on Sept 6, 2022 5:56:34 GMT
September update on sea ice extent at bottom of page 13,
|
|
|
|
Post by justme on Sept 8, 2022 13:36:22 GMT
Daily NSIDC sea ice area had a single daily gain of 36,000 square kilometers for 9.7.2022. The previous day (9.6) had a loss of 10,000 square kilometers. We did see a late season push in terms of sea ice extent and area loss. We will finish above the 2010's average in both categories. 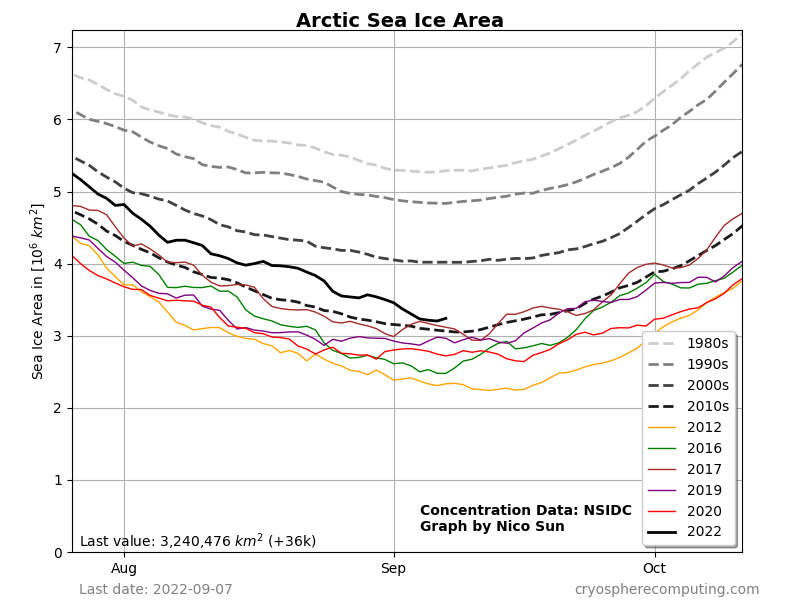 I may end up with egg on my face, but I believe 9.6 is the minimum for NSIDC sea ice area single daily values. The area of lower concentration sea ice at high latitudes is under an area of temperatures several degrees below freezing (Russian side). 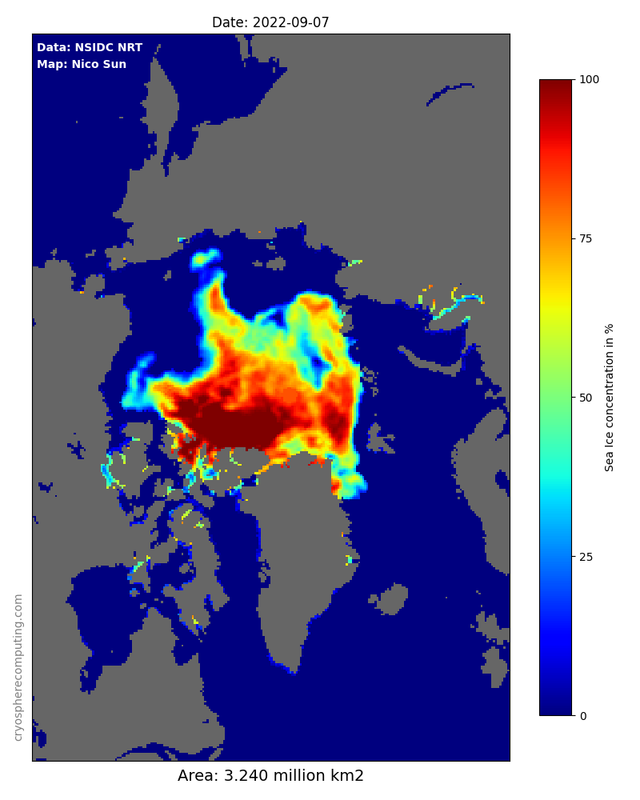 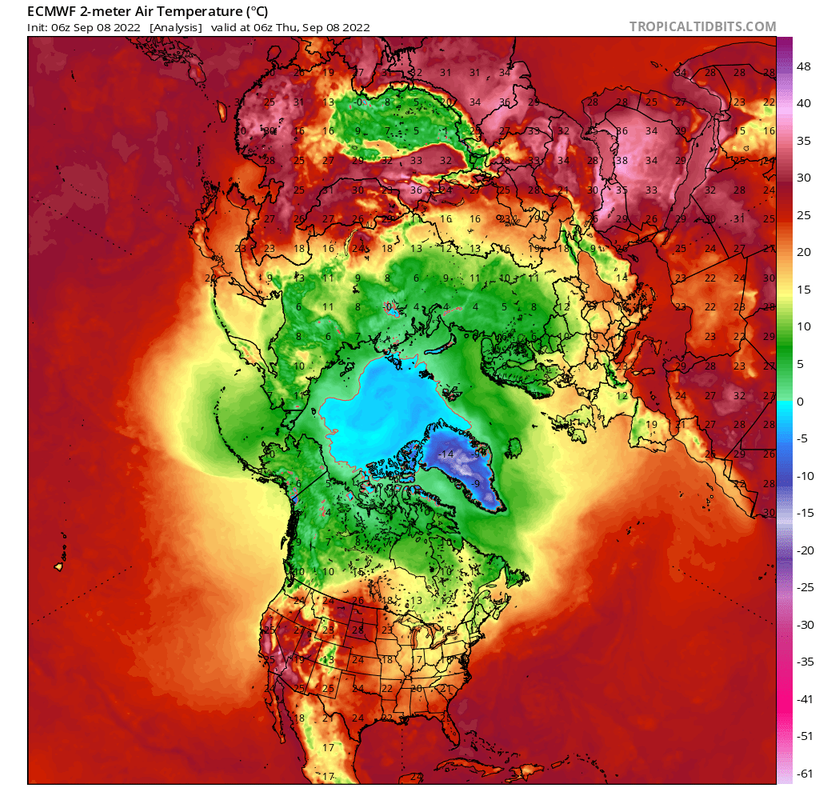 |
|
|
|
Post by neilhamp on Sept 18, 2022 6:25:39 GMT
Looks like sea ice might have reached its minimum on 16th.September.
See bottom of page 13.
BTW, Ratty, decided to include sea ice area as well as extent.
|
|
|
|
Post by neilhamp on Sept 21, 2022 6:13:23 GMT
Minimum occurred on 16th.
See my update at the bottom of page 13
|
|
|
|
Post by ratty on Sept 21, 2022 7:52:39 GMT
Minimum occurred on 16th. See my update at the bottom of page 13 Disappointing.  |
|
|
|
Post by Sigurdur on Oct 9, 2022 23:14:48 GMT
nsidc.org/arcticseaicenews/After reaching the minimum on September 18, Arctic sea ice extent has been steadily increasing. With the passage of the equinox, the sun has set at the North Pole. September average ice extent ended up tying with 2010 for eleventh lowest in the satellite record.
|
|
|
|
Post by ratty on Oct 10, 2022 0:42:14 GMT
nsidc.org/arcticseaicenews/After reaching the minimum on September 18, Arctic sea ice extent has been steadily increasing. With the passage of the equinox, the sun has set at the North Pole. September average ice extent ended up tying with 2010 for eleventh lowest in the satellite record. It's going downhill at the moment.  |
|
|
|
Post by missouriboy on Oct 10, 2022 1:36:49 GMT
The Worm has turned.
|
|
|
|
Post by neilhamp on Oct 15, 2022 6:23:08 GMT
Since August 2021, March is the ONLY MONTH in which the month end sea ice extent has fallen below the average for the 2010's decade| Month | 2021 | 2021 | 2022 | 2022 |
| Position | Difference from 2010's avge. | Position | Difference from 2010's avge. |
|
| Sq.Km. |
| Sq.Km. | | Jan.31st. | 7th.lowest | +79,452 | 16th.lowest | +333,064 | | Feb.28th | 7th.lowest | -161,829 | 11th.lowest | +116,764 | | Mar31st | 6th.lowest | -296,133 | 10th.lowest | -127,470 | | Apr.30th. | 9th.lowest | +1632 | 10th.lowest | +16,886 | | May.31st. | 7th.lowest | +64,174 | 15th.lowest | +395,097 | | Jun.30th. | 6th.lowest | -119,772 | 10th.lowest | +35,744 | | Jul.31st. | 5th.lowest | -147,168 | 11th.lowest | +218,102 | | Aug.31st | 11th.lowest | +410,141 | 12th.lowest | +383,054 | | Sep.30th. | 10th.lowest | +146,160 | 7th.lowest | +115,918 | | Oct.31st./14th. | 10th.lowest | +237,281 | 8th.lowest | +43,659 |
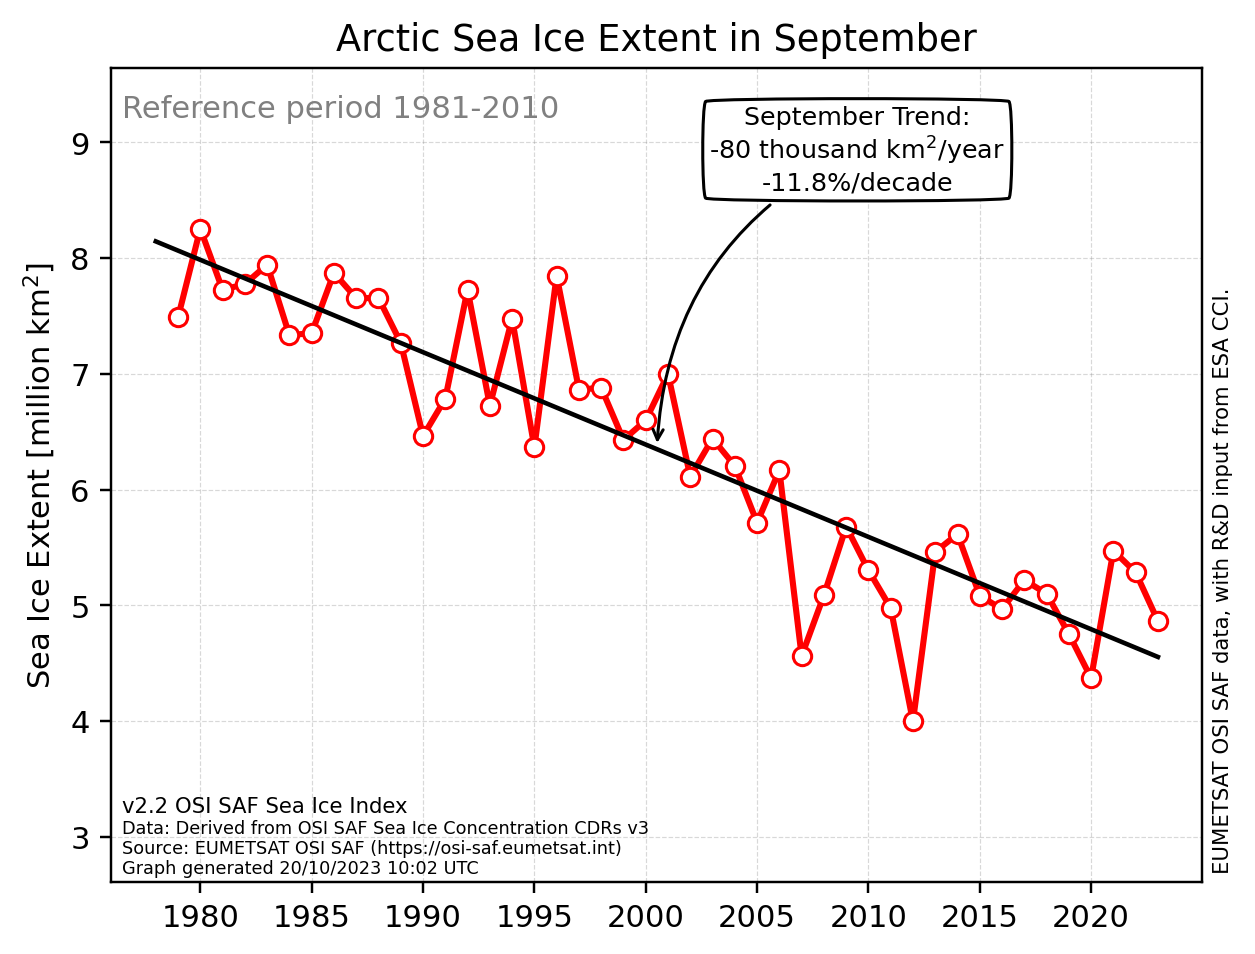
Since that big drop in 2007 the trend in September sea ice has been upward.
|
|
|
|
Post by blustnmtn on Oct 15, 2022 11:15:05 GMT
Since August 2021, March is the ONLY MONTH in which the month end sea ice extent has fallen below the average for the 2010's decade| Month | 2021 | 2021 | 2022 | 2022 |
| Position | Difference from 2010's avge. | Position | Difference from 2010's avge. |
|
| Sq.Km. |
| Sq.Km. | | Jan.31st. | 7th.lowest | +79,452 | 16th.lowest | +333,064 | | Feb.28th | 7th.lowest | -161,829 | 11th.lowest | +116,764 | | Mar31st | 6th.lowest | -296,133 | 10th.lowest | -127,470 | | Apr.30th. | 9th.lowest | +1632 | 10th.lowest | +16,886 | | May.31st. | 7th.lowest | +64,174 | 15th.lowest | +395,097 | | Jun.30th. | 6th.lowest | -119,772 | 10th.lowest | +35,744 | | Jul.31st. | 5th.lowest | -147,168 | 11th.lowest | +218,102 | | Aug.31st | 11th.lowest | +410,141 | 12th.lowest | +383,054 | | Sep.30th. | 10th.lowest | +146,160 | 7th.lowest | +115,918 | | Oct.31st./14th. | 10th.lowest | +237,281 | 8th.lowest | +43,659 |
Since that big drop in 2007 the trend in September sea ice has been upward.
 Looks like the bottom of a multi-decadal cycle has been reached and now is beginning to go positive (at least for September’s data). The data is noisy and I’m not in anyway proposing this as fact or even theory. However, ~1985-2015 could represent the positive-negative peaks of a ~30 year cycle. |
|
|
|
Post by neilhamp on Oct 15, 2022 12:20:23 GMT
Quite agree blustmntn,
Thats why I decided to make the comparison this year with the 2010's average.
So far, we are keeping above the average.
It will take one or two more years before the trend becomes clear.
Much depends on the long-awaited drop in the AMO which has, unfortunately, taken a sudden upturn this month
Best wishes,
Neil
|
|