|
|
Post by missouriboy on Sept 9, 2023 13:47:13 GMT
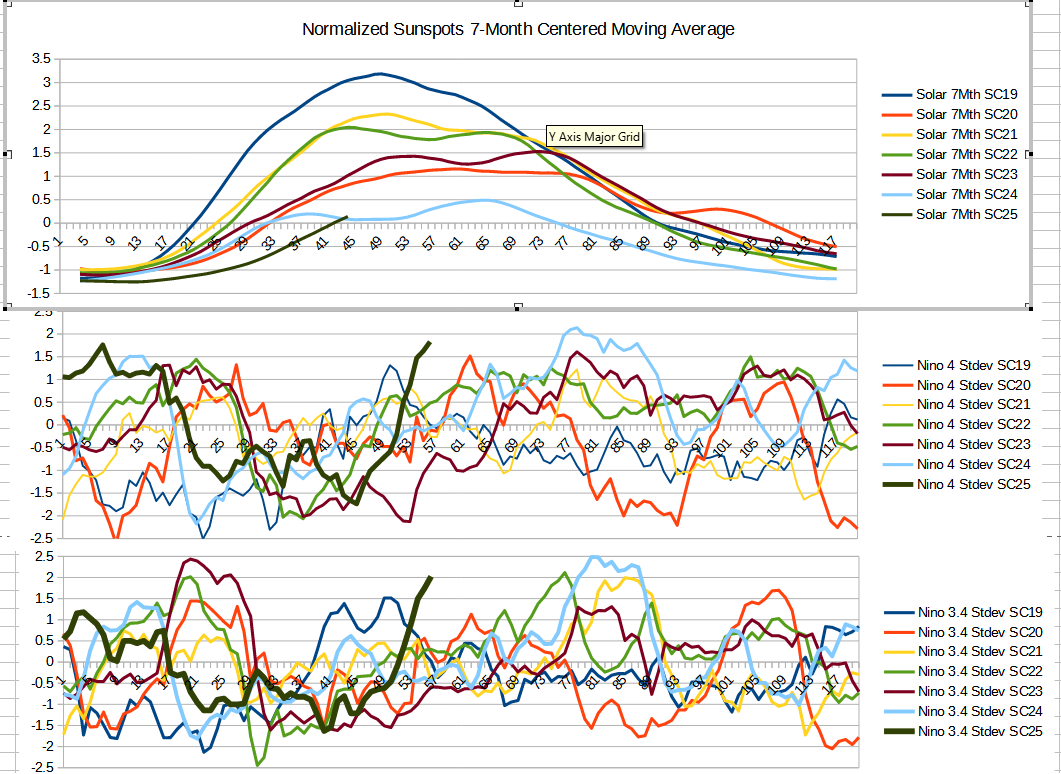
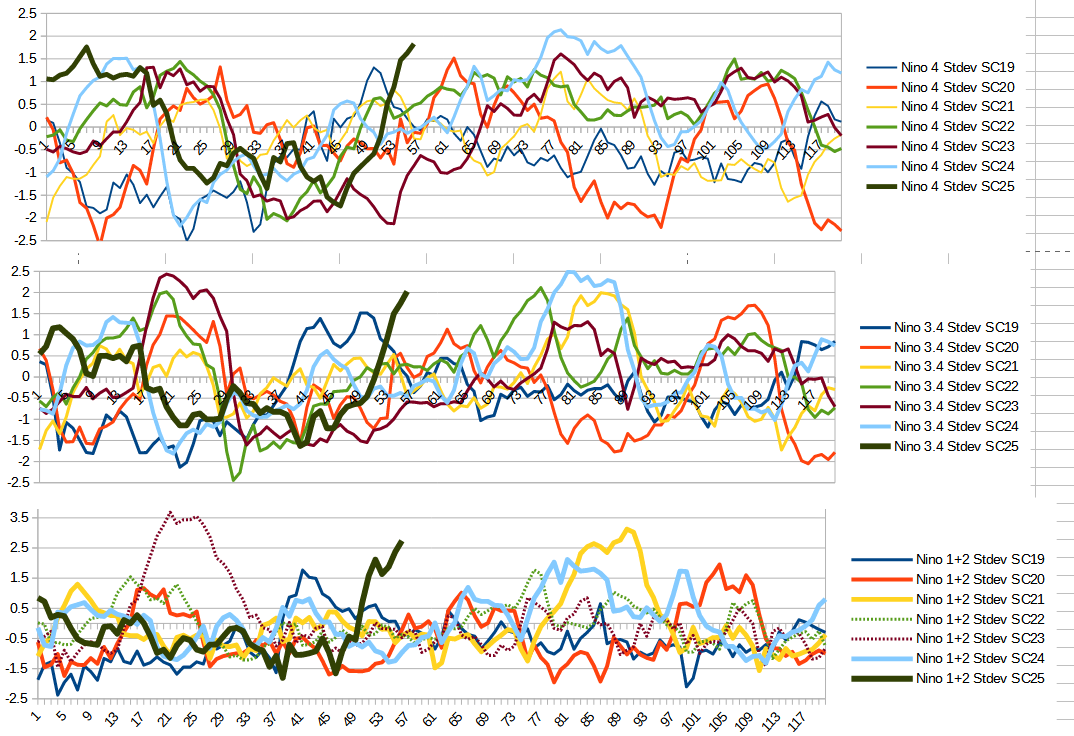
Monthly ENSO values (First 10 Years) for each Solar Cycles 19-25, Regions 4, 3.4 and 1+2 ... With comparison to normalized 7-Month sunspots by Solar Cycle El Ninos tend to occur at two general locations during the solar cycle. First El Ninos tend to occur 1) in the first 2.5 years of the solar cycle as it is ramping up. Of our seven solar cycles since 1950, only SC19 (the first & largest cycle since 1950) did not have an El Nino in this time period. Solar cycles 20 to 23 had El-Ninos in the second-third year from the cycle start date, Solar cycles 24 & 25 had El Ninos in the first 1.5 years from cycle start date. I have not seen an explanation for this.
Solar cycle 19 (the largest in the 1958-2023 period) did not have its first El Nino until its third-fourth year ... which was its seemingly singular sunspot peak,
Second El Ninos tend to occur across a broader time band, from the The majority of cycles have fairly large El Ninos in the 6th to 7th years of the cycle, as it passes it's second peak. Solar cycle 20 pulled off a 2nd El Nino in its 9th year. Solar cycle 25 is setting a new, early 2nd peak it seems. More similar to the first peak of SC19. Is this an indicator that SC25 might be a single-peak cycle that is approaching the start of its decline? You might be right .
   |
|
|
|
Post by ratty on Oct 3, 2023 21:32:47 GMT
Recently, the ENSO focus seems to be almost entirely on ocean temperatures. When I first learned about ENSO, there was a lot of focus on the overall equatorial weather patterns in the pacific, particular rainfall, which generally accompany the ocean temperature fluctuations along the equator. The “Multivariate ENSO” (MVENSO) measures both ocean temperatures and the weather. If the event does not match the weather features of an El Nino it is not ranked as an EL Nino, even though temperatures are high in the ENSO area. The Japanese call such events a fake El Nino. I bring this up because the MVENSO numbers for the current ENSO event are low compared to the NOAA ENSO numbers which are based solely on ocean temperatures. The most recent MVENSO value is 0.4 while the latest ENSO3.4 is much higher at 1.1. It’s still early, but is it possible that the MVENSO will not meet the definition often used for an El Nino of 5 consecutive periods of readings of 0.5 and above over the next few months while the ENSO3.4 meets that minimum requirement, thus resulting in a government declared El Nino even though it’s a fake El Nino? New classification: Reluctant El Nino. 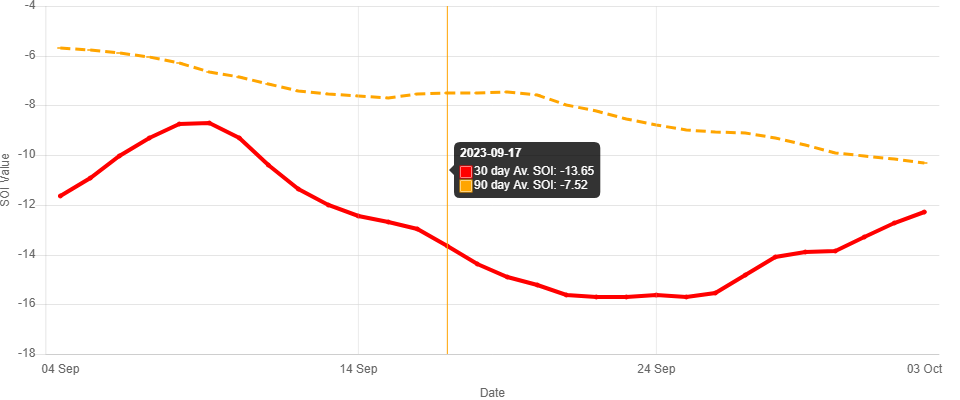 |
|
|
|
Post by missouriboy on Oct 4, 2023 13:49:29 GMT
Visually, the weekly SST graphic really struck me. Look at that bend to the southern hemisphere in the West Pacific. The western warm pool seems to be drifting south. Are we seeing the leading edge of another historical shift ... this time to the southern hemisphere? Compared to the northern shift in 1976. Again associated with low solar activity. The sample is small. Too bad we don't have equivalent instrumentation for the early 1970s (day late, dollar short). I have grabbed a snapshot for future reference.
So, first we see the IOD shift to a strong negative phase (largest in approximately 60 years) ... warmer water concentrated around Australia. Then we see what "appears" to be a "re-direction" of these waters to the south? Could this have anything to do with the historic low Antarctic sea ice concentrations over the last year?
Long way to go to Super El Nino territory, which is what is being presented to the press by whoever ... an additional 2C and 3 years for Nino Region 3.4 to match the backslope El Nino of SC24. But "Hottest Ever" dominates the news cycles. You've got to wonder if any discrete pressure is being applied behind the scenes to those at NOAA who read the Pacific instruments. Data professionals need to hold the line to "whatever the instrumentation says". The fact that "they" are lowering their forecasts is a good sign.
I remember you noting that "they" did the same thing back in 2013? Ten years later you would think that they would have learned something.
This graphic seems to show a westward contraction and cooling from April through June. This SST ... not SSTA.
  |
|
|
|
Post by missouriboy on Oct 4, 2023 14:36:15 GMT
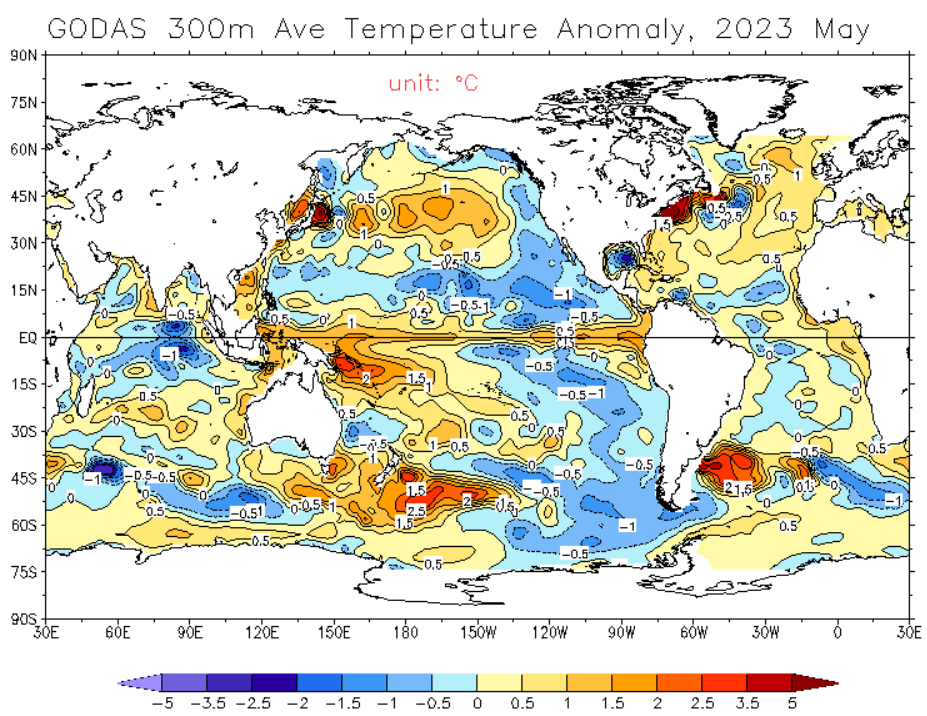
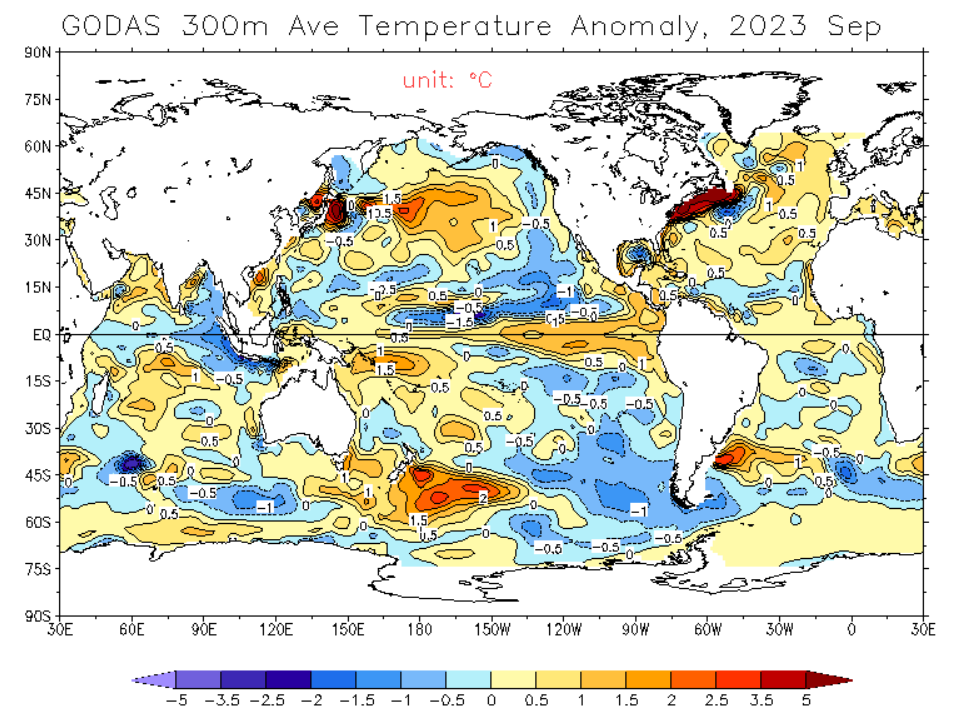
In support of the above ... GODAS 300-meter heat anomalies ... May and September, 2023. These Western Warm Pool warm water shifts to the south are not normal in this data series. Given that observation, I'm assuming that something "new" (in the timeseries) is happening. The great North Pacific gyre (as measured by the PDO) has declined. Is it now replaced by an increase in a currently unmeasured(?) southern gyre?
  |
|
|
|
Post by nonentropic on Oct 4, 2023 18:32:01 GMT
More rain in Australia? Warm oceans.
|
|
|
|
Post by ratty on Oct 4, 2023 23:32:37 GMT
More rain in Australia? Warm oceans. ... and a Non Nino? |
|
|
|
Post by missouriboy on Oct 4, 2023 23:59:28 GMT
More rain in Australia? Warm oceans. ... and a Non Nino? Still warm "exit" waters passing to your east. |
|
|
|
Post by duwayne on Oct 6, 2023 19:22:04 GMT
As I mentioned above, the ENSO3.4 and MVENSO are related, but measure somewhat different things. If you're looking at monthly global temperatures, ENSO3.4 is probably the best indicator to watch. On this and the previous board I have focussed on MVENSO because I think it is the best indicator of the overall ocean current 60-year cycle trend.
I think we are in the cool cycle and MVENSO tends to average significantly below normal during 30 year cool cycle period although it does bounce around over the period. Since we are in a cool cycle, I expected ENSO3.4 to not go to the heights predicted by NOAA of 2.0 as measured by the 5-month average of 3-Month readings.
It appears NOAA is backing off their 2.0 prediction and it's even possible the weekly ENSO values may have peaked for this ENSO3.4 cycle.
|
|
|
|
Post by missouriboy on Oct 6, 2023 21:07:59 GMT
As I mentioned above, the ENSO3.4 and MVENSO are related, but measure somewhat different things. If you're looking at monthly global temperatures, ENSO3.4 is probably the best indicator to watch. On this and the previous board I have focussed on MVENSO because I think it is the best indicator of the overall ocean current 60-year cycle trend. I think we are in the cool cycle and MVENSO tends to average significantly below normal during 30 year cool cycle period although it does bounce around over the period. Since we are in a cool cycle, I expected ENSO3.4 to not go to the heights predicted by NOAA of 2.0 as measured by the 5-month average of 3-Month readings. It appears NOAA is backing off their 2.0 prediction and it's even possible the weekly ENSO values may have peaked for this ENSO3.4 cycle.
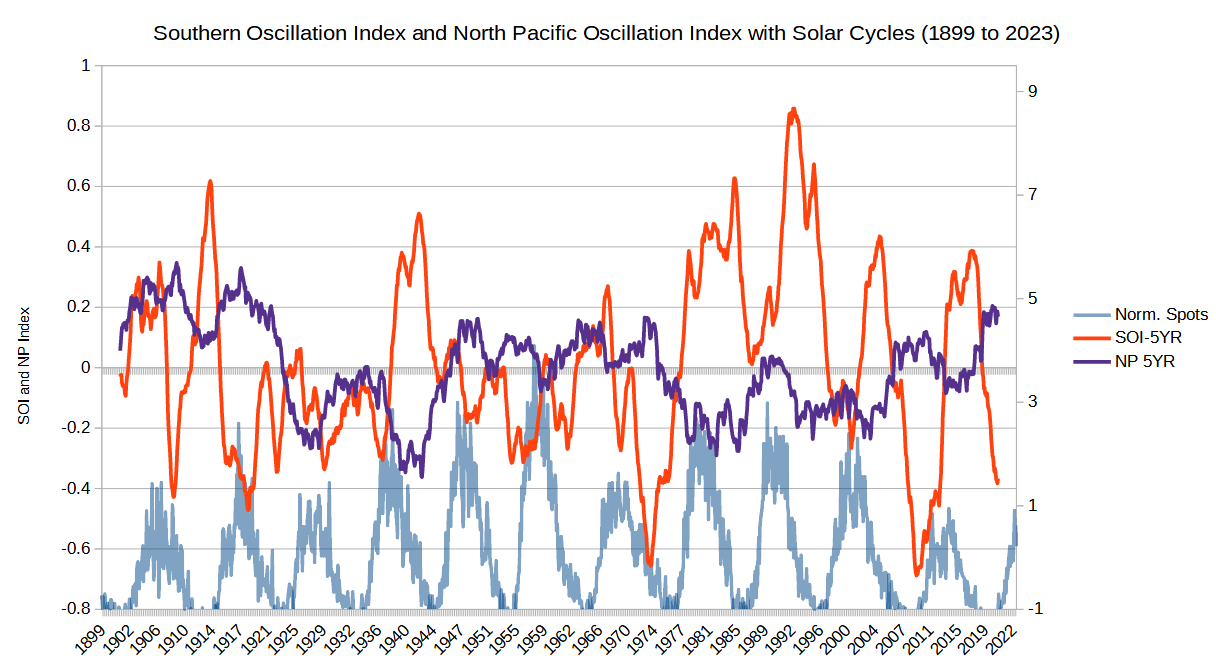
I think you're right. ENSO 3.4 has dropped back to the 1.0 range and the eastern-most regions are on their seasonal way down. If the SC25 ENSO trend ends up following something closer to SC20 (charts at top of this page) we could be looking at a cooler equatorial pacific by 2025. This could feed a cooling North Pacific trend ... opposite of the climate shift of 1976. Sure seems that the strong negative IOD of 2021-22 is getting flushed into the western South Pacific (GODAS). The North Pacific Oscillation is back in a strong positive phase as well.
 |
|
|
|
Post by missouriboy on Oct 23, 2023 13:23:50 GMT
The JMA Has El Niño Collapsing Next Year If a period of global cooling is indeed on the cards then we would expect La Niñas to be the dominate ENSO pattern. Supporting this theory are latest Japan Meteorological Agency (JMA) forecasts, which call for a collapsing El Niño next year, dipping below neutral perhaps as early as April, and potentially reentering La Niña territory by next summer: 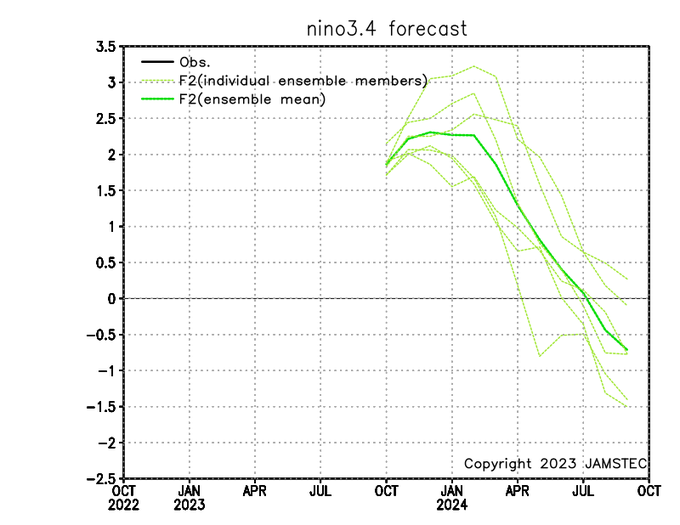 This JMA forecast looks a bit like the ENSO tracks of SCs 19 and 20 below. And the October 2023 start point for 3.4 will likely be lower.  |
|
|
|
Post by blustnmtn on Oct 23, 2023 17:19:37 GMT
The JMA Has El Niño Collapsing Next Year If a period of global cooling is indeed on the cards then we would expect La Niñas to be the dominate ENSO pattern. Supporting this theory are latest Japan Meteorological Agency (JMA) forecasts, which call for a collapsing El Niño next year, dipping below neutral perhaps as early as April, and potentially reentering La Niña territory by next summer:  This JMA forecast looks a bit like the ENSO tracks of SCs 19 and 20 below. And the October 2023 start point for 3.4 will likely be lower.  Climate Change!!! |
|
|
|
Post by nonentropic on Oct 24, 2023 21:19:02 GMT
|
|
|
|
Post by ratty on Oct 24, 2023 22:49:26 GMT
Unconvincing, reluctant, Non Nino? The IOD is strongly positive, not good news for Oz if Non becomes El. Apologies for taking you name in vain, Non. |
|
|
|
Post by nonentropic on Oct 25, 2023 1:54:43 GMT
fill in on the IOD impact on Australia and if you can stretch to Tasman sea and NZ?
|
|
|
|
Post by ratty on Oct 25, 2023 5:22:45 GMT
fill in on the IOD impact on Australia and if you can stretch to Tasman sea and NZ? Been a bit wet over there? |
|