|
|
Post by missouriboy on May 25, 2023 0:57:21 GMT
The numbers are SO BIG, I think there may be a problem with the algorithm. They looking to catch that Hale Bopp starship? I hear Al bought tickets.  |
|
|
|
Post by ratty on May 25, 2023 1:10:24 GMT
The numbers are SO BIG, I think there may be a problem with the algorithm. They looking to catch that Hale Bopp starship? I hear Al bought tickets.  It's cold out there ....  PS: I had to check whether that was Al or AI. |
|
|
|
Post by missouriboy on May 25, 2023 8:18:08 GMT
They looking to catch that Hale Bopp starship? I hear Al bought tickets.  It's cold out there ....  PS: I had to check whether that was Al or AI. Or whether there is a difference. Might need to ask Tipper. |
|
|
|
Post by missouriboy on Jun 2, 2023 19:29:27 GMT
A Return to the Great Pacific Climate Shift? It's time.
I found some regional time series for trade winds in the eastern, Central and western Pacific. Note that the Eastern Pacific trade winds appear to be rebounding during solar cycle 25. Not seen to such an extent since SC22. Duwayne reminds us again of the full cycle shift underway in the PDO. What is that southward moving cold flow in the northeastern Pacific? We have seen this before.  |
|
|
|
Post by missouriboy on Jun 3, 2023 12:56:54 GMT
Without updating this chart for the last 3 years, I am merely going to re-post it. The 5-year running trends seem obvious. Reinforcing data supporting the Great Pacific Climate Shift ... that which was, and will be again.
 |
|
|
|
Post by phydeaux2363 on Jun 4, 2023 15:40:58 GMT
Help me out here, Mr. MoBoy. Is it your premise that we are still in the warm Pacific mode that started in 1976, and are now shifting to a colder mode, or that we have already seen the colder mode and moving back to warm?
|
|
|
|
Post by missouriboy on Jun 4, 2023 16:32:56 GMT
Help me out here, Mr. MoBoy. Is it your premise that we are still in the warm Pacific mode that started in 1976, and are now shifting to a colder mode, or that we have already seen the colder mode and moving back to warm? My premise is that the data are pretty clear. We have had our 30 years of a warm El Nino-dominated North Pacific. And we are headed back to something more akin (at best) to the La Nina-dominated 1950s-70s. Just ran across a NOAA database on the North Pacific Oscillation (dominated by the Aleutians Low). This is counter to the SOI. When SOI is positive (El Nino) the NP is negative. You can see this winter's strong NPO that directed those atmospheric rivers into California. Code will be skiing for the next 20 years. Not sure if you get a cooler breeze on your porch ... or a porch that's blown away. If you figure that one out, let me know. The sub-tropics are looking more appealing.
Charles Oscar's band of ner-do-wells had best invest the last of those grants somewhere far from the fickle crowd. As the times they are a-changin.
 |
|
|
|
Post by phydeaux2363 on Jun 5, 2023 14:58:45 GMT
Thanks, Mr. Moboy. I was pretty sure that was what you meant, but squiggly lines on graphs always make me dizzy. As for my porch; well, it's the same old crapshoot every year. The only discernable pattern I see is that a CAT 4 or worse hits my stretch of beach about every 25-35 years. That's quite a range, but it should give me to 2030 before the porch blows away, and I doubt I'll still be around to see that.
|
|
|
|
Post by missouriboy on Jun 9, 2023 22:58:52 GMT
I've been continuing my search for previous work on other oscillations dealing with the periodic interchange of North and South Pacific waters. Found something from 2012 that was named the Pacific Centennial Oscillation (PCO). Doesn't seem to have caught on, but the general concept seems interesting ... and the ENSO/IOD data sets seem to be pointing to the possibility of such a reversal. Chart 1 below is for 1950-2023. Quite possible that we will continue to see declines for the remainder of SC25. So ... another 10 years, which would extend the interval to 80 years.
The natural climate pattern El Niño, which involves warming of the Pacific ocean and can cause regional flooding and drought around the world, is fairly well understood by scientists. Because the pattern happens on a roughly five year cycle, researchers can draw upon many different years of data to connect the dots and spot trends.
But if there were similar climate patterns that occurred only every few decades, or every hundred years, how would we know about them? That’s the question that Kris Karnauskas of the Woods Hole Oceanographic Institution and his colleagues were thinking about when they embarked on their latest research project. ”We base many of our conclusions about regional aspects of climate change on instrumental records we’ve obtained over only about 150 years,” Karnauskas told Oceanus. “So we might just be scratching the surface in terms of what is going on naturally over centennial timescales.”
When they put computer models to work evaluating climate patterns in the Pacific over the course of centuries, rather than years or decades, they uncovered a new pattern: Every hundred years or so, as depicted in the map above, water temperatures in certain areas off the west coast of North America and just east of Indonesia increase, while those in other areas near South America, Japan and Australia decrease. The pattern then flip-flops, during what they refer to as the “negative phase” of the cycle, then returns to the “positive phase” once again roughly a century later. Their findings about the pattern, which they call the Pacific Centennial Oscillation, or PCO, were published last week in the Journal of Climate.  |
|
|
|
Post by douglavers on Jun 10, 2023 11:30:30 GMT
SOI is solidly positive again. Adios El Nino?
As stated before, I think there may have been a systemic shift in worldwide weather patterns, which is unlikely to be good.
For example, North Atlantic Drift seems to have drifted much further South and faded.......... Interesting implications, if it continues, for the next winter in Europe.
|
|
|
|
Post by acidohm on Jun 10, 2023 12:50:09 GMT
Have to lose all this warmth  |
|
|
|
Post by missouriboy on Jun 10, 2023 13:56:17 GMT
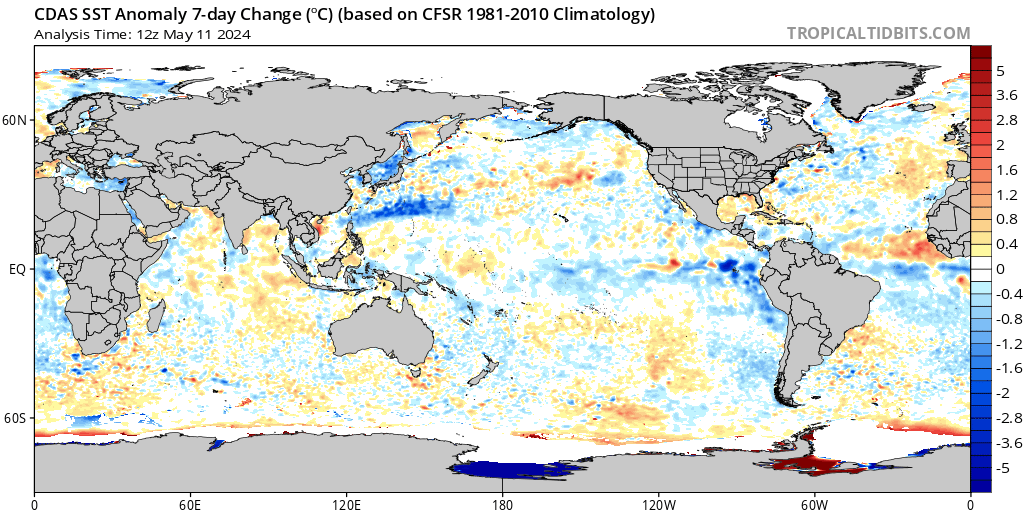
Have to lose all this warmth  Where do all these bubbles come from and disappear to? At least with Nino 1+2 we have some cross-sectional arrays. This one is a 2-week, +0.7C, down NAD-stream bubble? Or an up NAD-stream bubble? From the Iceland edge to the abyssal rim. A statistical mirage? Big one if so. Somewhere there is a techie with their eyes and ears on muttering ... "Wow Man! Do you see that?" Tuck it in closer Cap? She's gonna blow.  Ohh, for near-real-time statistical arrays. The PR-hirelings don't have a clue. They just make up sh_t to fit the narrative.  And the bigger Pacific picture. Seemingly lots of cold water circulating into the East Pacific from both north and south. That's a thin equatorial surface flow pushing westward on the edge of the renewed Trade Winds. And a big heated concentration northeast of Oz about 10S along the line of the Indonesian geothermal heat supplement. Notice how that heat-bubble sits along Indonesia.. Geographic eddy? Or geothermal input? Or both? IOD still negative ... boding ill for that East African drought. Reciprocal NPacific-SPacific (45N & 45S) heat bubbles keeping the flow going. I need to disassemble a monthly image-grab from this.  |
|
|
|
Post by missouriboy on Jun 11, 2023 16:55:11 GMT
Going back to the Great Climate Shift. I keep looking for databases that can document shifts in water temperatures between the South an North Pacific Oceans. This was a primary postulate for what happened about 1976 when the North went warm. The rise and fall of the PDO (chart above) shows a seeming full cycle completion from solar cycle 21 to now. So I pull up GODAS which documents sea-surface anomalies on a monthly basis (to 300 meters depth) since January 1979. This is 34 months into SC21, which followed low-cycle 20 ... which was when people started noticing that the north Pacific was warming up. Chart one below shows that 34 months is about the first peak on each solar cycle going forward. So I grabbed GODAS images at 34 months into each of solar cycles 21 to 25 (plotted on chart one). The 5 GODAS images are displayed below the chart.
Quick and dirty ... but it sure looks like an inter-basin shift in heat content. Starting with concentrations in the South Pacific in SC21 ... shifting to the North Pacific in solar cycles 22 and 23 ... and moving back to the South Pacific in solar cycles 24 and 25. Compare it to the PDO chart. Anyone who wants to play with GODAS can go here ... www.cpc.ncep.noaa.gov/products/GODAS/monthly.shtml      |
|
|
|
Post by missouriboy on Jun 16, 2023 12:06:58 GMT
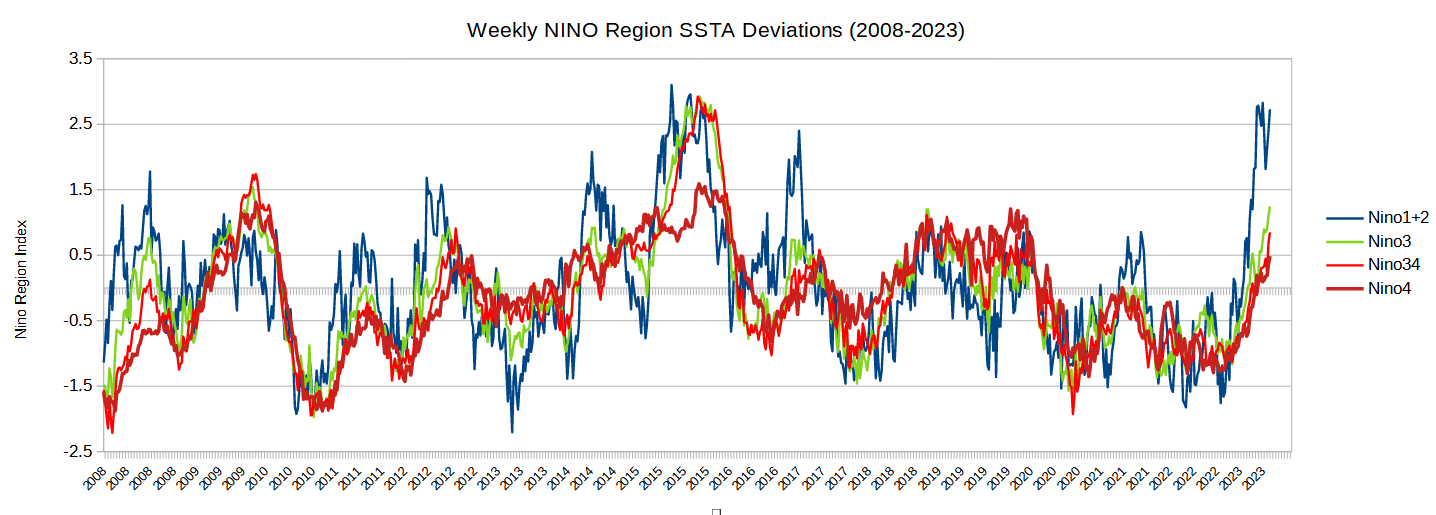
Looking at the latest weekly ENSO regions for solar cycle 24 and 25, we notice a large increase in region 1+2. This is a very small region and always happens to some extent in the late spring time frame. Highest since 2015. BUT the remainder of the regions ARE NOT. Comparable period to SC24 is 2012-13. This too will pass. And those praying for a huge Nino will be disappointed. SPECULATION: That huge negative IOD moved large amounts of warm water to the north and east of Australia in 2022 ... feeding the tropical warm pool (?). It has and is dissapating and will not not result in a surge akin to 2015. It seems to already be turning. We'll see. But the red curves are going to be down going into fall.  |
|
|
|
Post by flearider on Jun 16, 2023 19:24:30 GMT
Looking at the latest weekly ENSO regions for solar cycle 24 and 25, we notice a large increase in region 1+2. This is a very small region and always happens to some extent in the late spring time frame. Highest since 2015. BUT the remainder of the regions ARE NOT. Comparable period to SC24 is 2012-13. This too will pass. And those praying for a huge Nino will be disappointed. SPECULATION: That huge negative IOD moved large amounts of warm water to the north and east of Australia in 2022 ... feeding the tropical warm pool (?). It has and is dissapating and will not not result in a surge akin to 2015. It seems to already be turning. We'll see. But the red curves are going to be down going into fall.  by 2nd month of winter it will drop again .. just my thoughts .. |
|