|
|
Post by duwayne on Jul 4, 2022 16:25:20 GMT
I've revived this popular thread from the Cycle24 Board.
Missouriboy has uncovered a quasi 60-year cycle for the SOI and discussed it on the ENSO 21-22 thread. The average SOI for 1947-1977, the previous cold Ocean Current period was 1.8. For 2007-2022, the first 15 years of what is anticipated to be a new 30-year cool cycle, the average SOI also is 1.8.
The multivariate ENSO (MVENSO) calculations have been revised, but unfortunately they only go back to 1979. There was an older series and it showed the average MVENSO for 1947-1977 to be -0.3. The average for 2007-2022 is similar, -0.4.
The Pacific Decadel Oscillation (PDO) for 1947-1977 was -0.7. For 2007-2022 its -0.8.
These data all seem to be confirming we re in another cool period.
The AMO is also dropping but so far, not quite as fast as in the 1947-1977. Maybe it'll fall this month.
How about Global temperatures? Do they change in rhythm with the Ocean Current swings? In particular, do Global temperatures show a 60-year cycle?
This periodogram which I've shown before uses fancy statistical techniques to find cycles in data. In this case the data is the Hadcrut4 global temperatures going back to 1850.
|
|
|
|
Post by douglavers on Jul 5, 2022 11:52:14 GMT
ocean.dmi.dk/arctic/meant80n.uk.phpRecent temperature dip at the height of the Arctic Summer looks quite unusual. I assume it will bounce back up from here, otherwise not good outlook for next NH winter.
|
|
|
|
Post by ratty on Jul 5, 2022 11:58:40 GMT
ocean.dmi.dk/arctic/meant80n.uk.phpRecent temperature dip at the height of the Arctic Summer looks quite unusual. I assume it will bounce back up from here, otherwise not good outlook for next NH winter. That's actually a little concerning.  |
|
|
|
Post by missouriboy on Jul 6, 2022 20:30:10 GMT
I've revived this popular thread from the Cycle24 Board. Missouriboy has uncovered a quasi 60-year cycle for the SOI and discussed it on the ENSO 21-22 thread. The average SOI for 1947-1977, the previous cold Ocean Current period was 1.8. For 2007-2022, the first 15 years of what is anticipated to be a new 30-year cool cycle, the average SOI also is 1.8. The multivariate ENSO (MVENSO) calculations have been revised, but unfortunately they only go back to 1979. There was an older series and it showed the average MVENSO for 1947-1977 to be -0.3. The average for 2007-2022 is similar, -0.4. The Pacific Decadel Oscillation (PDO) for 1947-1977 was -0.7. For 2007-2022 its -0.8. These data all seem to be confirming we re in another cool period. The AMO is also dropping but so far, not quite as fast as in the 1947-1977. Maybe it'll fall this month. How about Global temperatures? Do they change in rhythm with the Ocean Current swings? In particular, do Global temperatures show a 60-year cycle?
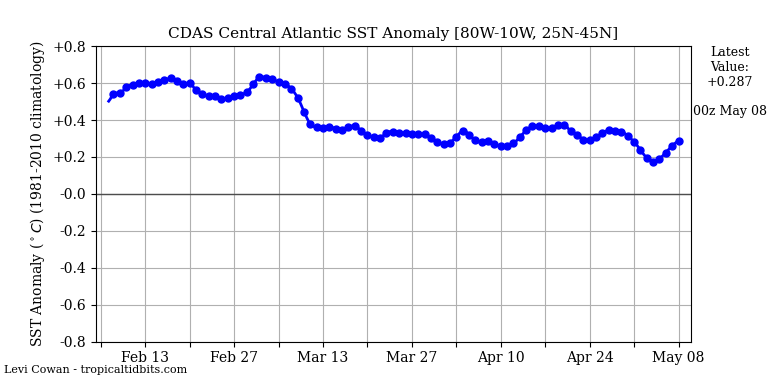
This periodogram which I've shown before uses fancy statistical techniques to find cycles in data. In this case the data is the Hadcrut4 global temperatures going back to 1850. Past data suggest that when the AMO falls, it falls hard and fast. Such a fall has been postulated to occur when the Beaufort gyre discharges its accumulating freshwater. This doesn't explain the rapid reversal years later. Tropical tidbits shows the southern half of the AMO area falling over the last few months. But it hasen't affected the AMO statistic.
 |
|
|
|
Post by missouriboy on Jul 6, 2022 21:49:09 GMT
Given the name of this thread, this article may be important here ... as it suggests, based on some semi-new research, that a cooling may be in order. Serious cooling could dramatically change the relevance of the data set trends that we have been tracking. It is notoriously difficult to successfully predict inflection points.
|
|
|
|
Post by nonentropic on Jul 7, 2022 1:28:20 GMT
They are all trying to isolate the LIA to Europe rather than global. Its a plan to pull the hokey stick into mainstream again.
From what I have read it was global that being derived from ice core at both poles and virtually all glacial regions of the world.
The Antarctic has the longest in duration over a million years and the Greenland ice cores less durable as you would expect the temperate region cores are often limited to only a part of the Holocene but do indicate that the LIA was global if variable in both magnitude and timing, ocean currents can dwell the shifts.
Palio in sediments is the final evidence and has a resolution of less than 0.5C these are from everywhere.
This narrative needs to be carefully watched.
|
|
|
|
Post by Sigurdur on Jul 7, 2022 1:55:37 GMT
The Arctic may have warmed slightly during the LIA.
Nons' post is spot ON!
|
|
|
|
Post by flearider on Jul 7, 2022 4:54:37 GMT
They are all trying to isolate the LIA to Europe rather than global. Its a plan to pull the hokey stick into mainstream again. From what I have read it was global that being derived from ice core at both poles and virtually all glacial regions of the world. The Antarctic has the longest in duration over a million years and the Greenland ice cores less durable as you would expect the temperate region cores are often limited to only a part of the Holocene but do indicate that the LIA was global if variable in both magnitude and timing, ocean currents can dwell the shifts. Palio in sediments is the final evidence and has a resolution of less than 0.5C these are from everywhere. This narrative needs to be carefully watched. it takes the poles to melt to get an ice age ... drop the salinity of the oceans ..weaken the currents.... boom .. every where go's cool .. |
|
|
|
Post by nonentropic on Jul 8, 2022 9:31:55 GMT
The Antarctic will not melt with the current ocean circulation regime it defines the current glacial phase but yes the Arctic is driven as you say.
|
|
|
|
Post by duwayne on Jul 23, 2022 0:59:51 GMT
Here are some projections from a new global temperature study which includes a heavy emphasis on Ocean Currents. Although there is not a lot of reference to the 60 year cycle in the study details, the final charts show the 60-year cycle clearly and they use “50-70 year smoothing” to get their final projections.
From their projection in Figure (e) you can derive global warming rates which are very close to my own projections from 2007 and for the same reasons. The projected warming, like my own MaxCon 1.0 estimate, is a little below the lower end of the IPCC estimate range.
I see us as being on the flat portion of the cyclical black (turning red) line starting around 2007 on chart e). They show a slight uptrend ahead which is consistent with what I have forwarned a few times as possible because of the current higher growth rate of CO2 emissions. But this uptrend is small.
Here is a link to the study which Judy Curry labels an “Important paper”. www.nature.com/articles/s41612-022-00275-1 |
|
|
|
Post by missouriboy on Jul 23, 2022 12:02:16 GMT
Thank you for finding this. When science (with forecasts) start to show significant "cooling", then maybe one can begin to see the end of the game. A decadal forecast of seriously growing Arctic Ice? There may be several cardiac events. This is going to take some serious reading ... and re-reading. Will 2022 be remembered as the year the "worm turned"? Reported cold events like those in this Electroverse issue may become common. Quasi-sixty-year cycles all over the place, And generally in all the expected low and high-solar locations.
|
|
|
|
Post by code on Jul 24, 2022 15:16:39 GMT
Thank you for finding this. When science (with forecasts) start to show significant "cooling", then maybe one can begin to see the end of the game. A decadal forecast of seriously growing Arctic Ice? There may be several cardiac events. This is going to take some serious reading ... and re-reading. Will 2022 be remembered as the year the "worm turned"? Reported cold events like those in this Electroverse issue may become common. Quasi-sixty-year cycles all over the place, And generally in all the expected low and high-solar locations.
Wish those curves were higher |
|
|
|
Post by missouriboy on Jul 24, 2022 15:37:08 GMT
Thank you for finding this. When science (with forecasts) start to show significant "cooling", then maybe one can begin to see the end of the game. A decadal forecast of seriously growing Arctic Ice? There may be several cardiac events. This is going to take some serious reading ... and re-reading. Will 2022 be remembered as the year the "worm turned"? Reported cold events like those in this Electroverse issue may become common. Quasi-sixty-year cycles all over the place, And generally in all the expected low and high-solar locations.
Wish those curves were higher All in good time Code. All in good time. |
|
|
|
Post by missouriboy on Jul 24, 2022 16:25:56 GMT
The Big Inverted "V" and how it will become the Big Up-Side-Down "W"
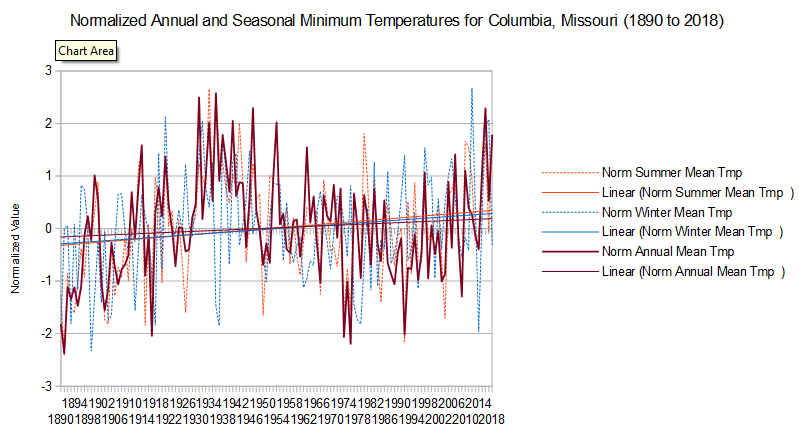
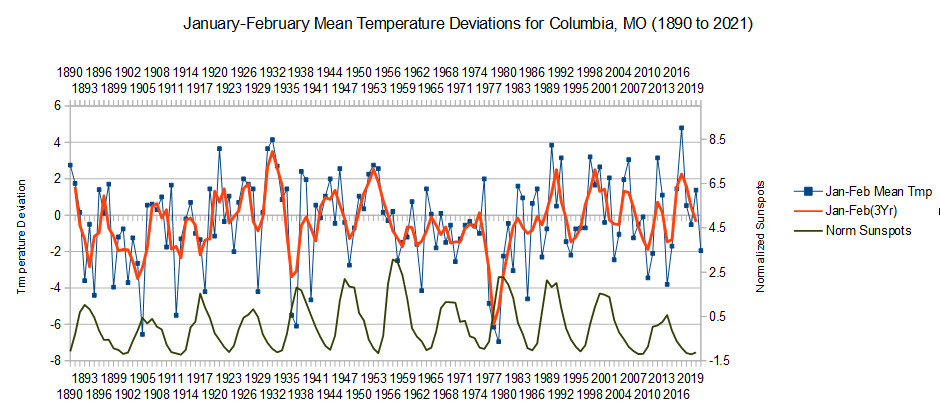
Was looking at some Northern Hemisphere Temperature time series from "the old days", before the Woke editors changed the data. I call it the Big Inverted "V". Or, if you wish ... "The Big Up-Side-Down V". It covers the period 1890 (or 1900) to about 1980.
You can see "the Big Inverted V" in many unmodified time series, like here in Middle Earth. I suspect, and have seen, the same for other places. If the truth be known, I could fill these pages with such from all over the World. Of course, the upward trend that started with the Great Climate Shift of about 1976, set off the Great Scare ... accompanied by the Great Raid on the Public Treasury. I suspect that we have passed the apex of the next "Big Inverted V", which will now become the "Big Upside-Down "W". See video clip below charts. A true classic of cinema and Human nature. Be sure that someone(s) will make money on this one too.
   |
|
|
|
Post by blustnmtn on Jun 22, 2023 0:37:03 GMT
|
|