|
|
Post by nonentropic on Apr 8, 2024 20:01:32 GMT
Doug that is a very interesting point the Hunga Tunga eruption was salt water as it was a sub-sea eruption. that would then mean a huge amount of salt was injected in the stratosphere and the nucleation impact has not been discussed or I have not come across it will they gradually percolate through the troposphere etc.
Not seen much on the amount of salt to impact nucleation but given the Gates's etc thing a bunch of ships can impact the climate from sea level I would have thought this was important.
Again above my pay scale but is there a difference between high clouds and lower clouds re heating or cooling impact?
|
|
|
|
Post by missouriboy on Apr 8, 2024 20:28:02 GMT
Doug that is a very interesting point the Hunga Tunga eruption was salt water as it was a sub-sea eruption. that would then mean a huge amount of salt was injected in the stratosphere and the nucleation impact has not been discussed or I have not come across it will they gradually percolate through the troposphere etc. Not seen much on the amount of salt to impact nucleation but given the Gates's etc thing a bunch of ships can impact the climate from sea level I would have thought this was important. Again above my pay scale but is there a difference between high clouds and lower clouds re heating or cooling impact? I went looking on Climate4you, but before I got to high and low clouds (it's there) I found this. Must be new as I haven't seen it before. Any wonder that UAH lower troposphere temp anomalies have been going up (exclusive of ENSO effect) since about 1999. The Data Guys are getting brazen.  Tally ho and straight on till morning. No prisoners. 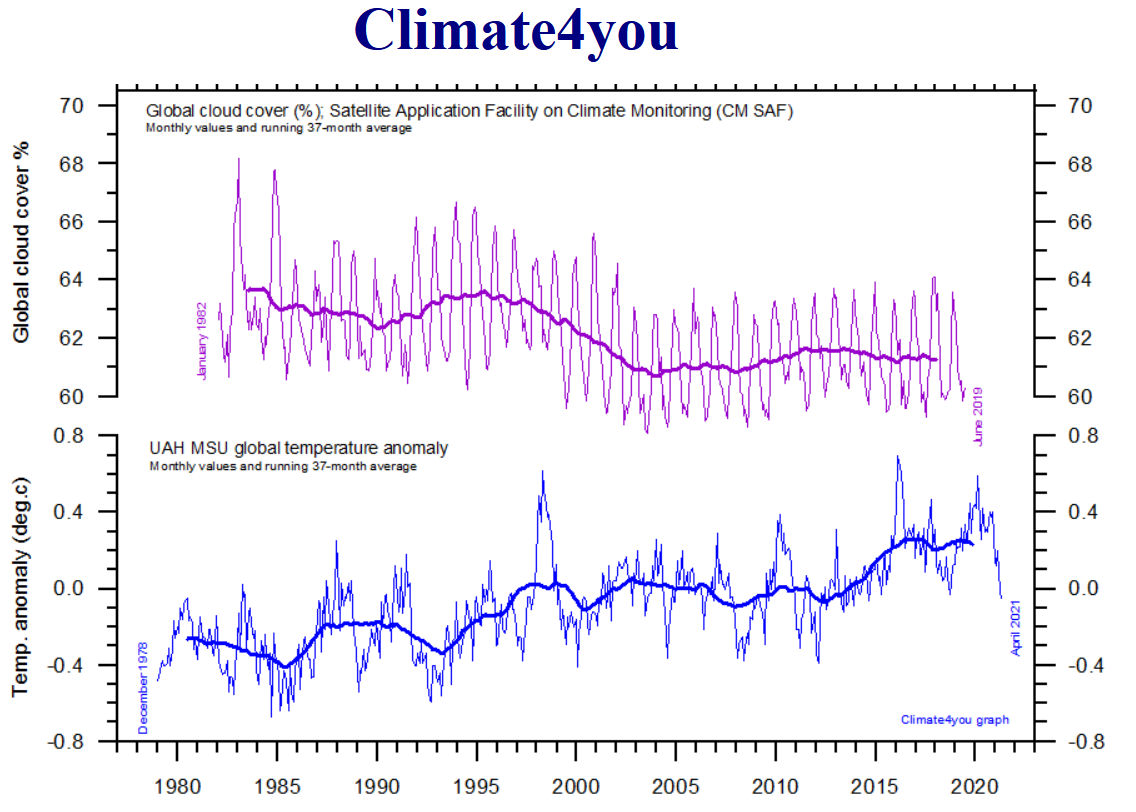 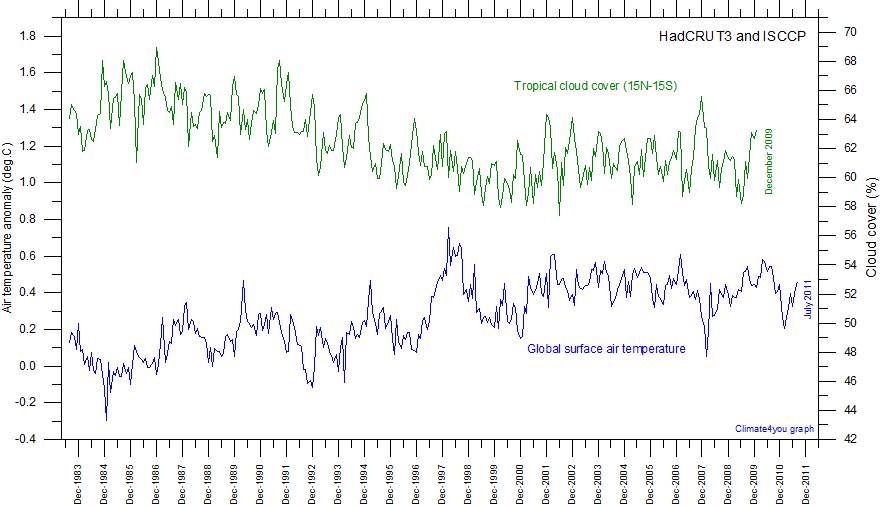 |
|
|
|
Post by duwayne on Apr 9, 2024 2:19:19 GMT
I've posted many times about what I believe is a quasi-60 yr global ocean current driven temperature cycle which is leading to a cooling effect on global temperatures causing them to show only slight growth over the 2007-2037 period.
I've referred to 3 numbers which help document the cycles, the PDO, MVENSO and AMO. I predicted the PDO for 2007-2037 would be -0.7, the same as the previous cycle 60 years earlier, and its since 2007 it's averaged -0.9. I predicted the MVENSO to to average -0.3 and its running at -0.4. So far, so good.
On the other hand I predicted the AMO which peaked at the beginning of the current cycle around the year 2007 would fall to zero around the half-way point of the cycle. We passed that a year ago and it has not been close. Unfortunately, the AMO has not been updated lately, but the surrogate numbers which have been posted here are remaining high.
But things may be changing. The AMO appears to be dropping recently. I'll follow up with another post when I get a minute.
Here’s why I think the AMO might be moving lower if the data were available.
Missouri has posted in the past temperature anomalies of 3 regions of the Atlantic Ocean which are published regularly in tropical tidbits.
Looking at the coordinates of these areas it would appear they cover most of the North Atlantic and probably includes much of the data for the AMO calculation. I’ve forgotten most of what I learned about geometry, but I’ve made an attempt to calculate the relative size of the 3 areas from their coordinates and I come up with 24%, 36%, and 40%, respectively for the north, mid and south regions of the total area.
Using the latest anomalies for these regions, 0.106, 0.332, and 0.839 I come up with a weighted average anomaly for the Atlantic area represented by these regions to be 0.494, say 0.5.
My guess is these numbers are not detrended. From earlier discussions based on your chart, I believe the detrend adjustment should be -0.5 giving a possible AMO number of 0.0.
These numbers bounce around big time as you will know if you’ve looked at past AMO values so I’m not arguing that the AMO is at 0 but it may be trending down somewhat after staying high for so long. |
|
|
|
Post by missouriboy on Apr 9, 2024 4:59:49 GMT
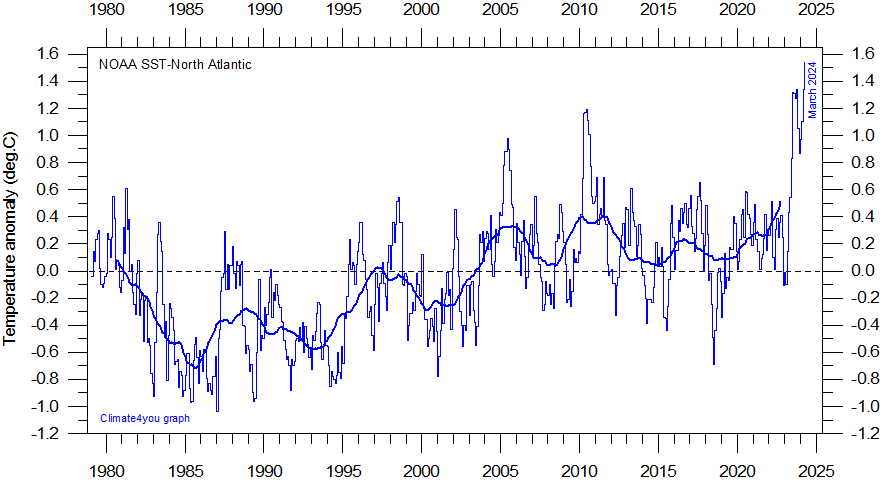
Nice approach. And none of the N Atlantic ocean temp values on Climate4you show any decline. In fact, they show an amazingly large increase (see chart below). Don't know how to retrieve past Tropical Tidbit values for comparison. But I suggest we start saving monthly averages from Tropical Tidbits for updating. The January 2023 value is about the same as the TT January 2024 value. So the TT monthly running average for Jan-Mar would be about 0.5, 0.4 and 0.25. Huge difference from the 1.3 in the following chart. Highest evah. How do they do that?
 |
|
|
|
Post by missouriboy on Apr 9, 2024 18:31:19 GMT
Update on the above chart. The fine print says it is for 5-20 North. So not the North Atlantic in total.
|
|
|
|
Post by missouriboy on Apr 10, 2024 22:30:13 GMT
Children will definitely know what snow is.
|
|
|
|
Post by missouriboy on Apr 11, 2024 2:10:02 GMT
In the spirit of the times. From Wattsupowiththat
|
|
|
|
Post by missouriboy on Apr 11, 2024 23:34:16 GMT
The Sea giveth. The Sea taketh away. Morons abide.
|
|
|
|
Post by ratty on Apr 12, 2024 0:33:34 GMT
The Sea giveth. The Sea taketh away. Morons abide. He will win. |
|
|
|
Post by missouriboy on Apr 13, 2024 1:19:49 GMT
I continue to look for indicators that "point" at sources and mechanisms for the heating of the North Pacific associated with the Great Climate Shift of 1976 ... and forecast if and when that heat might shift back to the south. One possibility is a periodic change in the warmth of South Pacific waters moving equator-ward with the Humboldt Current.
The Southern Annular Mode (SAM) is the leading mode of extratropical Southern Hemisphere climate variability, associated with changes in the strength and position of the polar jet around Antarctica. This variability in the polar jet drives large fluctuations in the Southern Hemisphere climate, from the lower stratosphere into the troposphere, and stretching from the midlatitudes across the Southern Ocean to Antarctica. wires.onlinelibrary.wiley.com/doi/10.1002/wcc.652 So what does the SAM and the Nino 1+2 Region show? Since the end of SC19, all three variables show the makings of a convex curve. Sunspots have peaked and are declining. Nino 1+2 and SAM are on the flat middle of what could become a declining arm. While warmings and coolings of South Pacific waters input to the westward moving ENSO wave could perhaps affect the general temperature of the water available for circulation ... it does not seem to account for the rapidity of the change. A geothermal pulse would seem to be a more likely culprit. But nobody has shown a dataset that would document such an event. 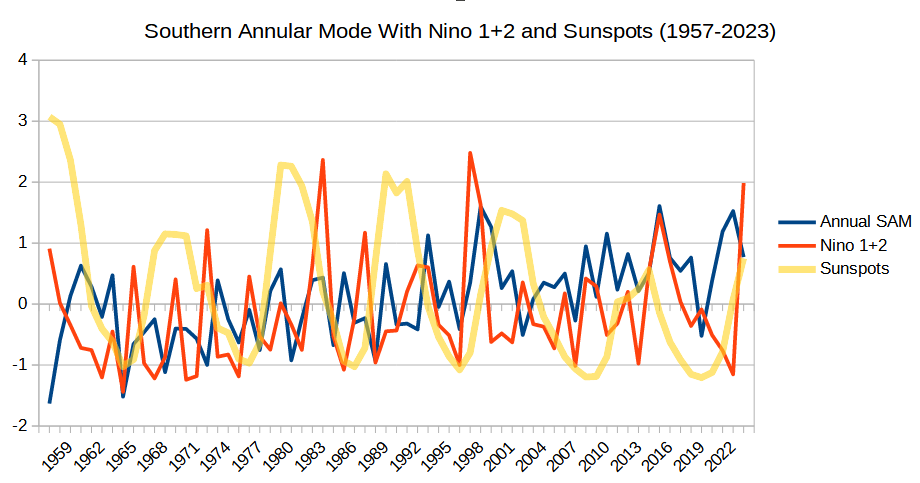 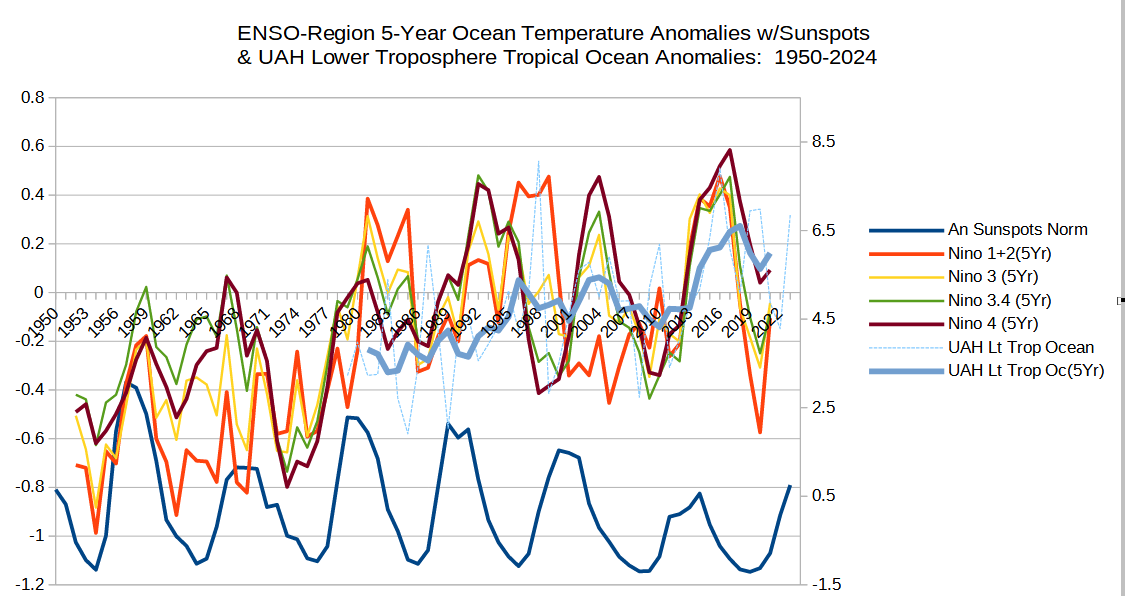) |
|
|
|
Post by missouriboy on Apr 19, 2024 20:59:35 GMT
|
|
|
|
Post by missouriboy on Apr 21, 2024 16:57:44 GMT
How we know that the sun changes the Climate. Part I: The past  |
|
|
|
Post by missouriboy on Apr 24, 2024 22:22:24 GMT
The Oceans carry our base load. Does this look in the least bit scary? So far the Western Warm Pool is staying warm.Only a hint at a decline. But amplitude of the wave seems to have declined since SC23.
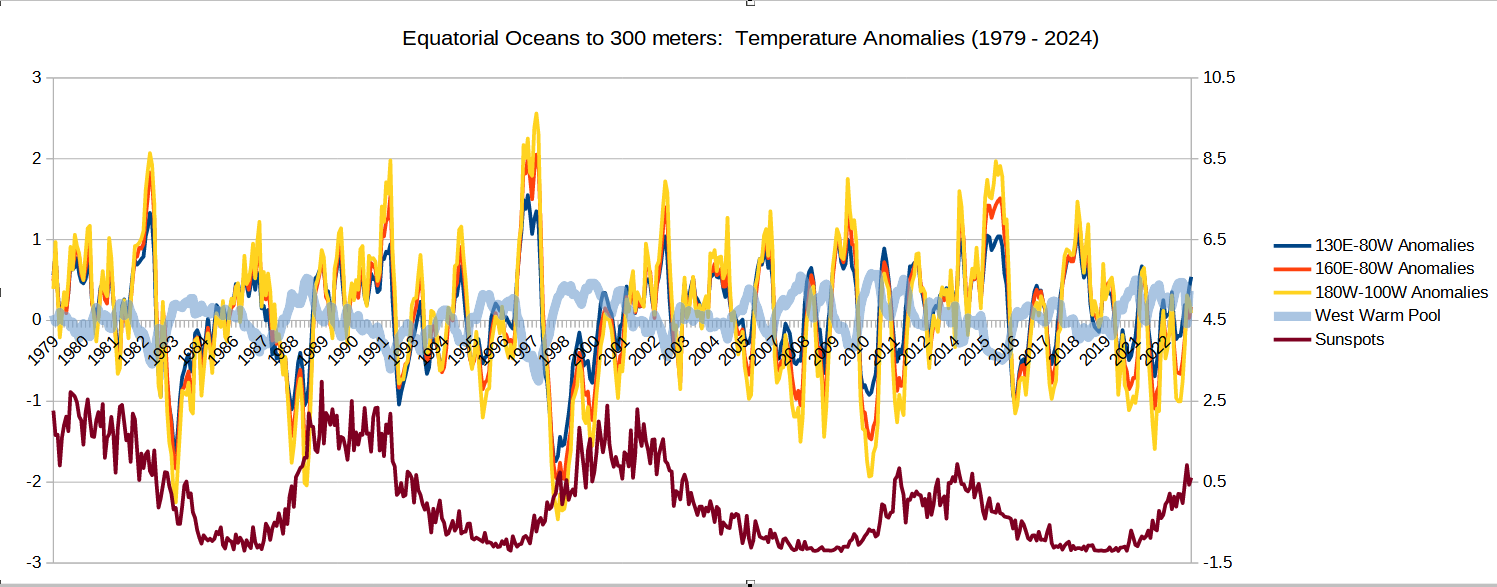 |
|
|
|
Post by missouriboy on Apr 25, 2024 23:12:32 GMT
This could go many places, but since the sun is admitted (even by the Catastrophists) to be the primary energy source for our planet, I will put it here. Right in the heart of science.
Temporal & Spatial Thermal Response to Heat Input, Transfer & Retention in the Climate System
FRANK knew! |
|
|
|
Post by missouriboy on Apr 26, 2024 19:37:52 GMT
Tropical West Pacific (ENSO4) cloud cover declined after SC22 and IR-2-Space went up. Our planet is settling into a cooler state. I found a link into the cloud database files. Calculate your own area and extract the data. Nice. Kudos to the data guys putting this together. Four years out of date though. 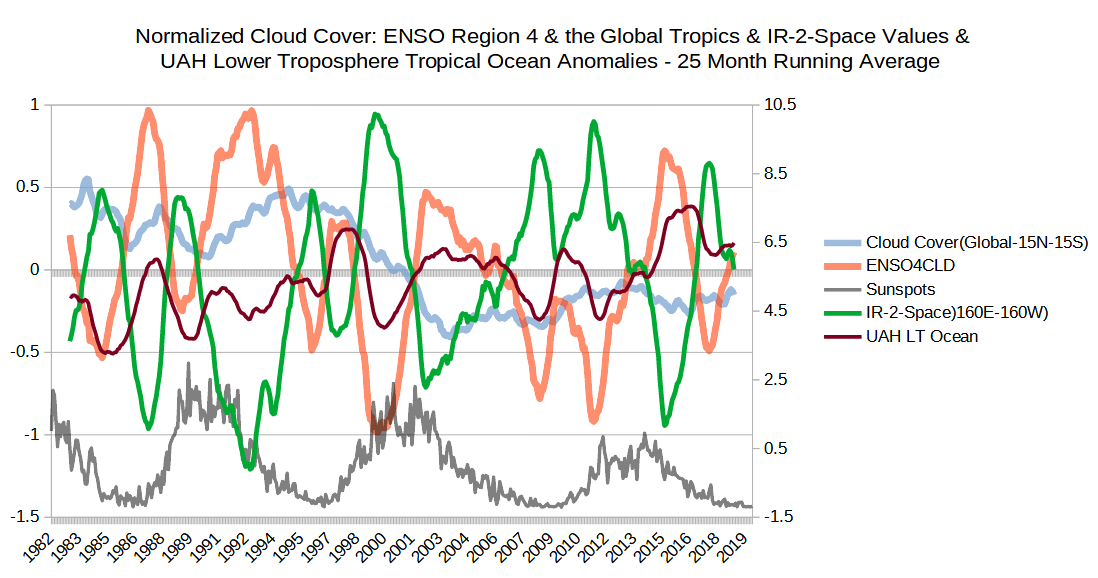 |
|