|
|
Post by douglavers on Mar 9, 2024 21:10:32 GMT
The February satellite global temperature anomaly was +0.93degC.
I do not understand why it spiked up from near parity a few months go.
This seems to be quite inconsistent with the pretty savage winter which has been reported for Northern Europe, Russia, Asia and Alaska.
I am in danger of becoming a true sceptic as I am starting to think the figure is meaningless!
|
|
|
|
Post by ratty on Mar 9, 2024 22:16:37 GMT
The February satellite global temperature anomaly was +0.93degC. I do not understand why it spiked up from near parity a few months go.
This seems to be quite inconsistent with the pretty savage winter which has been reported for Northern Europe, Russia, Asia and Alaska. I am in danger of becoming a true sceptic as I am starting to think the figure is meaningless! Hunga Tonga–Hunga Haʻapai? |
|
|
|
Post by ratty on Mar 9, 2024 22:20:17 GMT
|
|
|
|
Post by missouriboy on Mar 10, 2024 0:35:10 GMT
The February satellite global temperature anomaly was +0.93degC. I do not understand why it spiked up from near parity a few months go. This seems to be quite inconsistent with the pretty savage winter which has been reported for Northern Europe, Russia, Asia and Alaska. I am in danger of becoming a true sceptic as I am starting to think the figure is meaningless! Lower troposphere temps always spike with ENSO and decline as it subsides. This one is slightly higher than in 2015-16 even though this ENSO is lower than then. MAYBE this says something about that Hunga-Tonga water vapor input into the lower stratosphere slowing the IR loss to space. Or not.  Fear not Doug. It will all come clearer someday. |
|
|
|
Post by ratty on Mar 10, 2024 11:28:46 GMT
|
|
|
|
Post by Sigurdur on Mar 10, 2024 16:21:38 GMT
|
|
|
|
Post by missouriboy on Mar 14, 2024 19:18:14 GMT
A much simplified, graphical view of how UAH-measured lower troposphere temperature anomalies for the tropical oceans are (may be) related to solar energy inputs to the tropical Pacific Ocean released to the troposphere (as measured by ENSO 3.4) ... and modified by IR radiation to space (as measured by NOAA over the Central Pacific Ocean). IR-2-Space is counter-cyclical to ENSO. I assume this is due largely to increased cloudiness during ENSO events. UAH Lower Troposphere temperatures over the tropics go up during ENSO (with a lag) when IR-2-Space is low ... and go down after ENSO events, when IR-2-Space goes up. All indicators (except sunspots) represent 5-Year, centered moving averages. Note that IR-2-Space values were lowest during large solar cycles SC22 and 23, and highest during our most recent low cycles 24 and 25. Title says "Tallies". I should have said "Moving Averages". 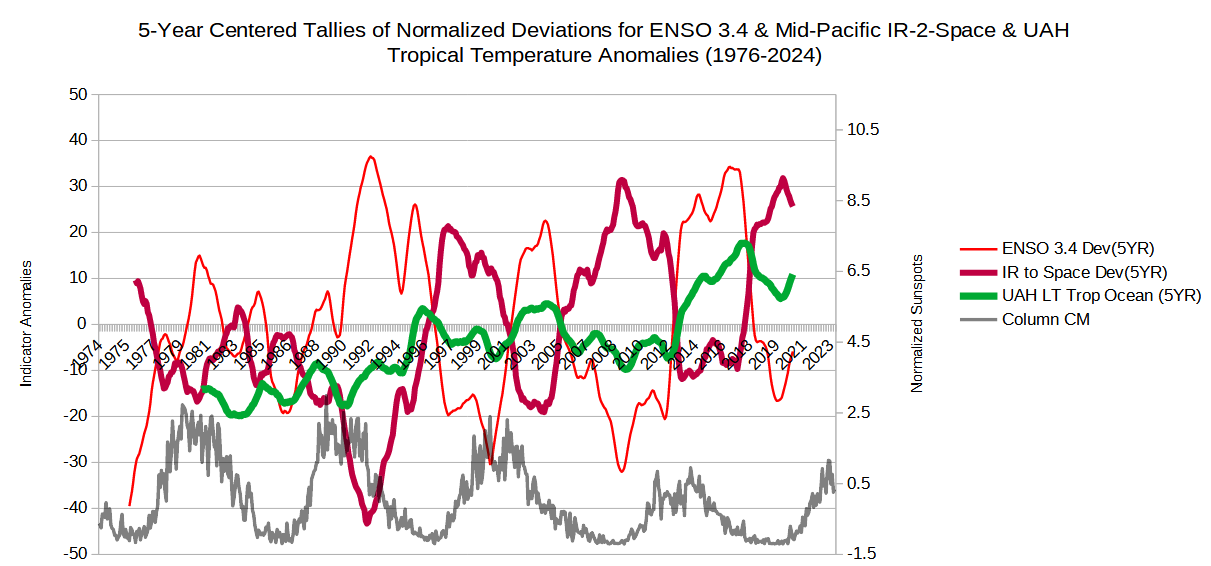 |
|
|
|
Post by missouriboy on Mar 21, 2024 1:02:45 GMT
"Climate ... the movie" is here. Pretty good actually.
|
|
|
|
Post by ratty on Mar 21, 2024 10:50:41 GMT
"Climate ... the movie" is here. Pretty good actually.
|
|
|
|
Post by missouriboy on Mar 22, 2024 1:40:12 GMT
Not sure if this was posted before/ |
|
|
|
Post by missouriboy on Mar 29, 2024 15:14:42 GMT
This should scare the Be-Jesus out of the Climate Smurfs. They can only hope to outlive the dawn of the obvious.  Climate is a lagged cumulative event. God does have a sense of humor. The downslope between SC25 and 26 could be exciting.  |
|
|
|
Post by ratty on Mar 29, 2024 22:50:13 GMT
This should scare the Be-Jesus out of the Climate Smurfs. They can only hope to outlive the dawn of the obvious. Climate is a lagged cumulative event. God does have a sense of humor. The downslope between SC13 and 14 could be exciting. Could you incorporate long term temperature data (CET?) into that graph? |
|
|
|
Post by missouriboy on Mar 30, 2024 5:58:53 GMT
OK Ratty. Here are the UAH Global Lower Stratosphere and Lower Troposphere temp. anomalies over the oceans. These only go back to 1978. Global Lower stratosphere anomalies peak during high cycles 21 & 22 and have declined since. Global Lower Troposphere anomalies peak during ENSO events and decline between. Spread is upwards of 2C. Globally, the 2023 El Nino does not come close to the 2015-16 El Nino.
as a 2-year average. I will resurrect the CET and plot likewise. It is Easter after all. 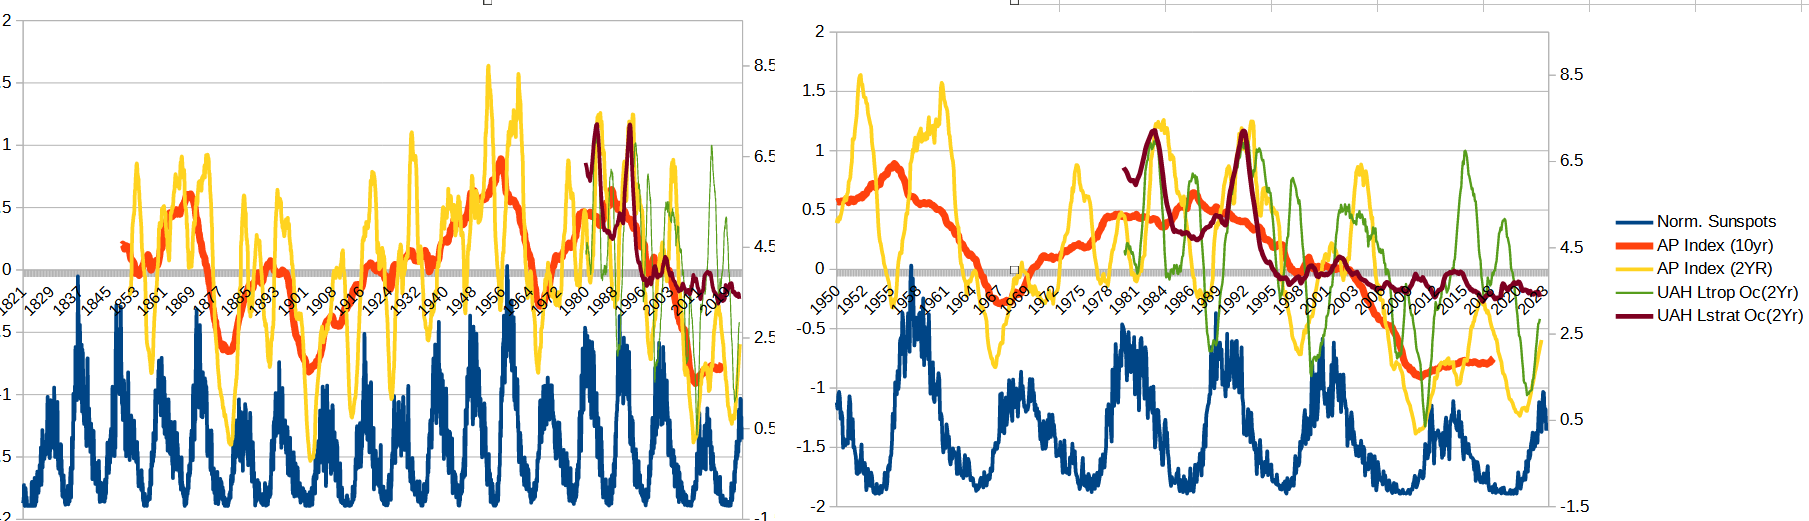 |
|
|
|
Post by ratty on Mar 30, 2024 7:15:00 GMT
OK Ratty. Here are the UAH Global Lower Stratosphere and Lower Troposphere temp. anomalies over the oceans. These only go back to 1978. Global Lower stratosphere anomalies peak during high cycles 21 & 22 and have declined since. Global Lower Troposphere anomalies peak during ENSO events and decline between. Spread is upwards of 2C. Globally, the 2023 El Nino does not come close to the 2015-16 El Nino.
as a 2-year average. I will resurrect the CET and plot likewise. It is Easter after all. " It is Easter after all". What? Now you want double time? PS: Thanks. |
|
|
|
Post by duwayne on Mar 30, 2024 14:10:49 GMT
OK Ratty. Here are the UAH Global Lower Stratosphere and Lower Troposphere temp. anomalies over the oceans. These only go back to 1978. Global Lower stratosphere anomalies peak during high cycles 21 & 22 and have declined since. Global Lower Troposphere anomalies peak during ENSO events and decline between. Spread is upwards of 2C. Globally, the 2023 El Nino does not come close to the 2015-16 El Nino.
as a 2-year average. I will resurrect the CET and plot likewise. It is Easter after all. Missouri, any predictions on what the UAH anomalies might look like late this year and next year? |
|


 Fear not Doug. It will all come clearer someday.
 Climate is a lagged cumulative event. God does have a sense of humor. The downslope between SC25 and 26 could be exciting.