|
|
Post by Sigurdur on Jul 13, 2022 3:40:17 GMT
Geo Thermal
|
|
|
|
Post by flearider on Jul 13, 2022 6:01:14 GMT
polarportal.dk/en/greenland/surface-conditions/This is the DMI Greenland Mass Balance website. Recently it has been showing rapidly increasing run-off from the ice-sheet. As part of the site, it shows weather conditions at a selection of locations all around Greenland [click on small dark bulls-eyes]. Looking at those sites, I could only find one which showed a temperature [slightly] above freezing. Not, in my amateur view, enough to cause any significant melting. So, where cometh the melting? suns reaching it's max of the 11 yr cycle .. so all that influx of light /heat protons .. comes in thru the poles .. will be fine next yr  thats my guess  |
|
|
|
Post by nonentropic on Jul 13, 2022 6:24:58 GMT
beware the AMO
|
|
|
|
Post by douglavers on Jul 13, 2022 11:38:41 GMT
The point is that most of the Greenland Ice Sheet is still well below freezing.
Even with full Summer insolation, at best the Sun might melt a few centimtres of snow, which would almost immediately refreeze as it hit much colder ice below the surface.
There might be some ice loss from evaporation [sublimation], but I can't imagine that process removing gigatons.
So, I think my question remains unanswered.
|
|
|
|
Post by Sigurdur on Jul 13, 2022 13:09:24 GMT
The point is that most of the Greenland Ice Sheet is still well below freezing. Even with full Summer insolation, at best the Sun might melt a few centimtres of snow, which would almost immediately refreeze as it hit much colder ice below the surface. There might be some ice loss from evaporation [sublimation], but I can't imagine that process removing gigatons. So, I think my question remains unanswered. At some time I have read that Greenland has significant geo Thermal going on. Much like Antarctica. The position of Greenland, close to Iceland, would seem to confirm the geo idea. |
|
|
|
Post by Sigurdur on Jul 13, 2022 13:11:39 GMT
|
|
|
|
Post by blustnmtn on Jul 13, 2022 17:50:47 GMT
I’m copying this link to the “Greenland” topic thread. |
|
|
|
Post by blustnmtn on Jul 18, 2022 12:14:44 GMT
Interesting paper: www.nature.com/articles/s41612-022-00275-1“The multidecadal AMV-component reached recently the maximal warming (Fig. 1a, Fig. 7a) like the 1940s-to-1950s. This was followed by a negative NAO, North Atlantic cooling, Eurasian cooling and sea-ice extension, which resulted in long-term hiatus in wintertime global warming (1950s–1970s). In line with the life cycle of the coupled Atmosphere/Ocean oscillation (Fig. 3c, d, Fig. 4, Supplementary Fig. 8), the multidecadal NAO-component is currently moving into the negative phase (Figs. 1 and 7b), the SSWs are becoming more frequent57, the precipitation and associated extremes in the western Mediterranean are increasing12, and there is an indication of an ongoing weakening of the AMOC59,60. The introduced coupled oscillation and associated statistical climate projection suggests that the ongoing negative NAO-trend will continue (Fig. 7), which can lead to further increase (decrease) of the precipitation in the Southern (Northern) Europe, a weakening of the AMOC and subpolar Atlantic-gyre and therefore to multidecadal sea-ice extension and Atlantic cooling trend, like the period 1950s–1970s” |
|
|
|
Post by douglavers on Jul 18, 2022 13:07:03 GMT
|
|
|
|
Post by ratty on Jul 19, 2022 5:13:59 GMT
|
|
|
|
Post by Jane in the centre of England on Jul 19, 2022 10:20:17 GMT
A question Preamble: there are four fundamental forces in nature, correct? Gravity, electromagnetism, weak and strong nuclear forces, correct? So my question is, when one of those forces weakens on our home planet, namely the electromagnetic force, does it have any effect on the climate? How would I set about investigating that? PS I finally found a graph showing the north magnetic pole cantering across the arctic. Here it is: www.ncei.noaa.gov/maps/historical_declination/ |
|
|
|
Post by flearider on Jul 19, 2022 11:43:35 GMT
A question Preamble: there are four fundamental forces in nature, correct? Gravity, electromagnetism, weak and strong nuclear forces, correct? So my question is, when one of those forces weakens on our home planet, namely the electromagnetic force, does it have any effect on the climate? How would I set about investigating that? PS I finally found a graph showing the north magnetic pole cantering across the arctic. Here it is: www.ncei.noaa.gov/maps/historical_declination/not sure where you get nuclear forces from ... but electromagnetism yes it effects just about everything ..as it weakens your getting more force/juice from the sun and galactic plain ..the highs and lows on the earth are where this force/juice comes in and go's out .. well one of the ways .. the high-energy particles from the galactic plain cause more cloud with more cloud with the power from the sun you get more weather .. at least thats how i understand it ..  |
|
|
|
Post by Jane in the centre of England on Jul 19, 2022 11:59:22 GMT
Thank you Flearider. Yes, the Svensmark hypothesis about cosmic rays 'seeding' clouds seems to have attracted a lot of controversy.
|
|
|
|
Post by blustnmtn on Jul 19, 2022 12:17:49 GMT
|
|
|
|
Post by missouriboy on Jul 19, 2022 21:29:24 GMT
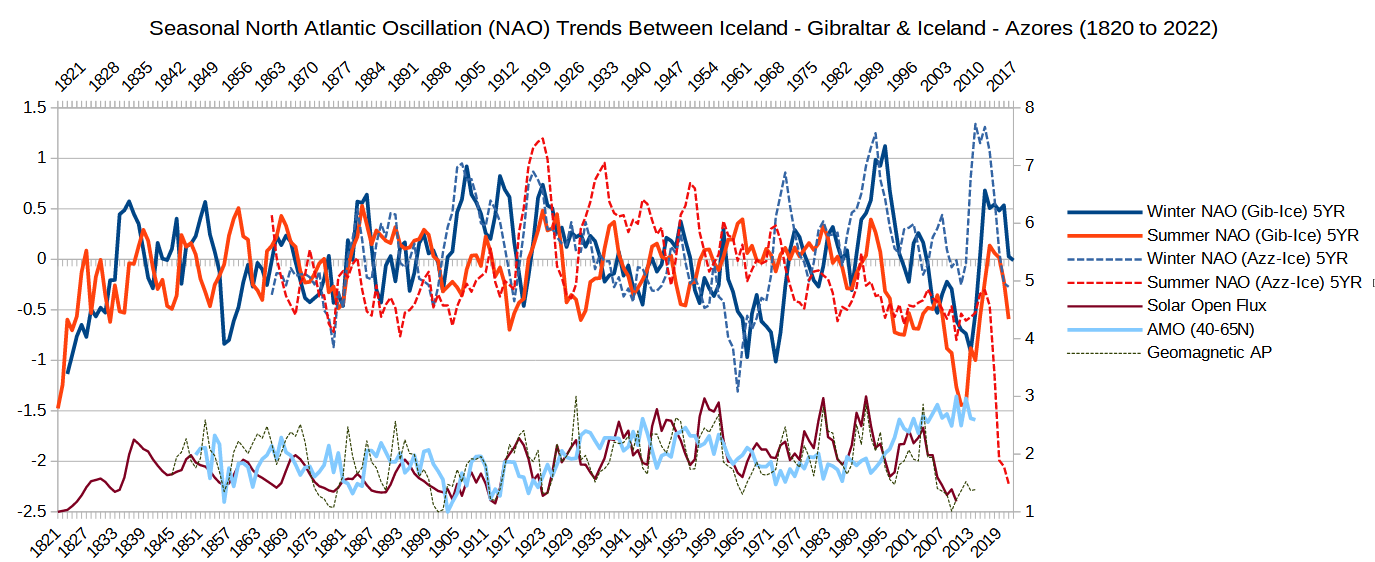
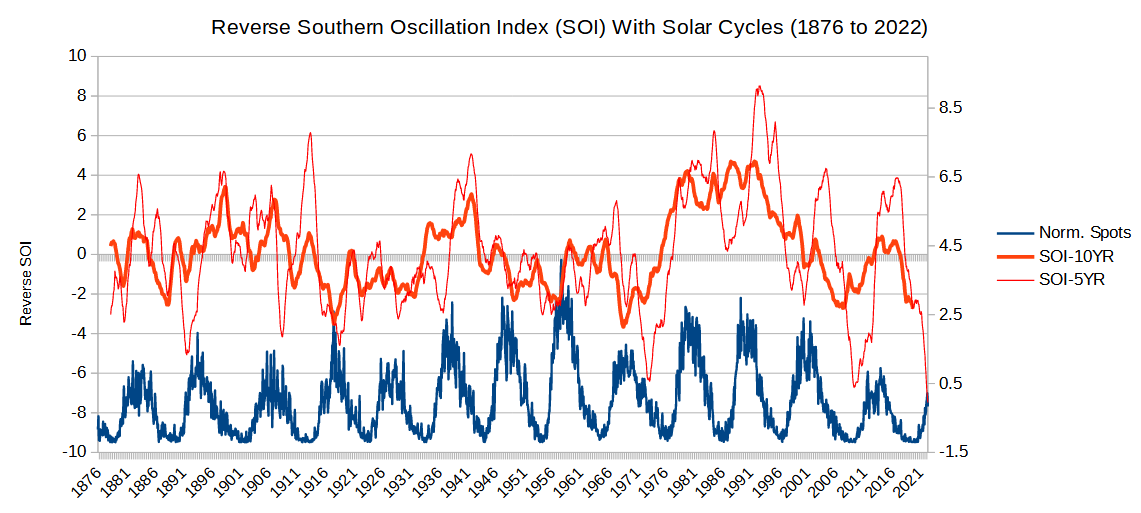
These two graphs may be useful to throw in here. They represent the two major atmospheric pressure gradients for which we have the longest data bases (back into the 1800s).
Chart 1 shows 5-year Winter and Summer North Atlantic pressure gradients (NAO) between two locations: Iceland and Gibraltar and Iceland and the Azores. It represents a north - south pressure-difference gradient between the Arctic and the sub-tropical high pressure zones of the North Atlantic Ocean. Iceland and Gibraltar data go back to 1820, which captures the exit slope of the Dalton Minimum. Here, the index shows periodic declines in surface pressures in the sub-tropics that are theorized to occur during low solar cycles, when the equatorial Hadley Cells weaken. The Dalton Minimum exit, the 1970s and solar cycles 24 and 25 all show strong negative NAO values. Summer NAO values for SC24 and 25 have not been replicated since the late Dalton Minimum.
Chart 2 shows 5 and 10-year pressure gradients between Darwin, Australia in the western tropical South Pacific and Tahiti in the tropical Mid-Pacific. It represents a west-to-east pressure gradient that is very closely associated with ENSO SSTAs. A reversal in this gradient is associated with the onset of El Nino events - a movement of warmer western tropical Pacific waters eastward. Weaker solar cycles are associated with colder water in the mid-Pacific. The 1970s and solar cycles 24 and 25 show negative ENSO values. It's too bad that we do not have comparable pressure data back to 1820. Any guess on what we would see?
  |
|