|
|
Post by blustnmtn on Oct 13, 2023 10:41:18 GMT
www.americanthinker.com/articles/2023/10/carbion_dioxide_does_not_cause_warming.html“There are two trees of gas physics: the professorial-theoretical tree in academia, beginning in 1662, and real-world gas physics, taught by private-sector engineers, beginning in 1836. The professorial tree began in 1662 with Boyle’s law (pv=k, higher the pressure, lower the volume). American Meter company engineers invented the gas meter in 1836, the same dual-bellows meter that sits in front of your home. That began the non-theoretical tree, which is supported by real science — testing.”
|
|
|
|
Post by ratty on Oct 13, 2023 11:55:44 GMT
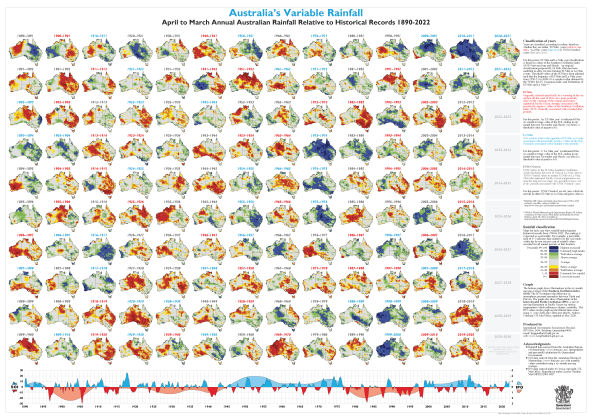
In the Land Down Under the media is becoming obsessed with the prospect of drought, fire and high temperatures. Every classroom should have one of these charts on its wall to give students some perspective - when talk turns to climate change - on just how dry Australia is: Click anywhere on the image for a bigger version ....  Source Source |
|
|
|
Post by missouriboy on Oct 13, 2023 14:24:50 GMT
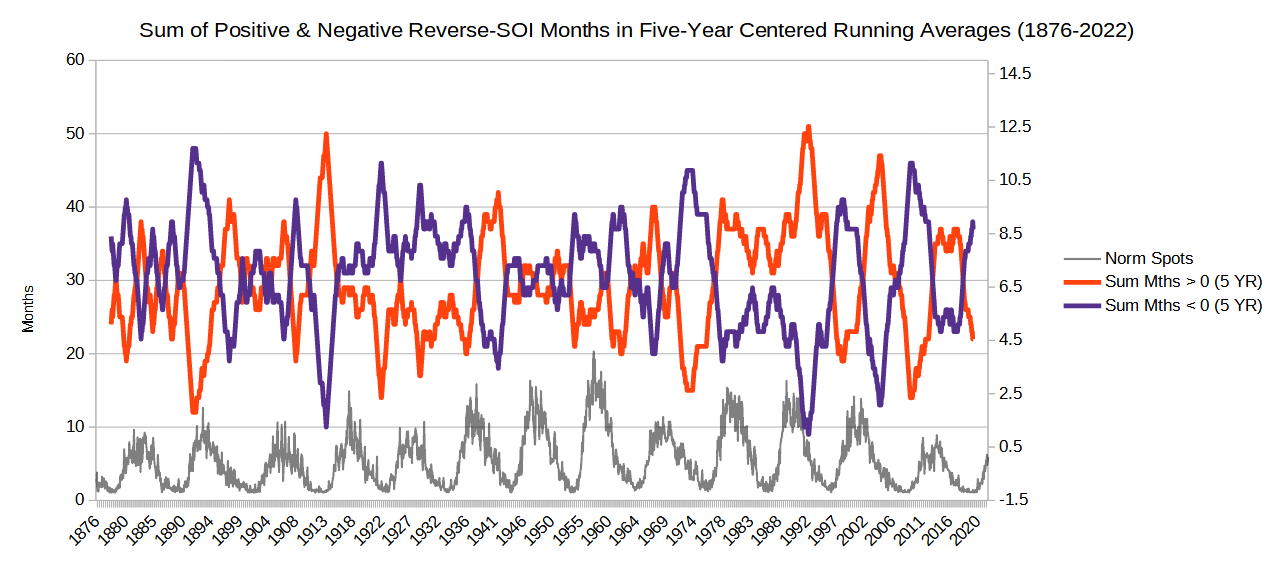
Note that Australia's wet-dry sequence is also approximately a 60-year cycle. The Big Dry starting about 1976 coincides with what is referred to as the 1976 climate shift ... when the northern hemisphere went warm.
Note comparison of 5-Year reverse SOI (think ENSO) from 1876. Positive El Nino. Negative La Nina.
 |
|
|
|
Post by Sigurdur on Oct 13, 2023 16:52:40 GMT
|
|
|
|
Post by blustnmtn on Oct 24, 2023 12:29:30 GMT
|
|
|
|
Post by missouriboy on Oct 25, 2023 19:47:26 GMT
Another extreme in the cyclone world. Hard to tag this one on Charles Oscar ... but they'll give it the old believer effort. I remember there was a big northward moving hurricane (pierced SE Missouri) in 2012 that broke the dry summer dome. Same point SC24. Amazing how weather-climate events may recur to some extent in conjunction with solar dynamics.
|
|
|
|
Post by ratty on Oct 25, 2023 23:21:09 GMT
|
|
|
|
Post by Sigurdur on Nov 1, 2023 14:05:55 GMT
|
|
|
|
Post by ratty on Nov 8, 2023 10:42:30 GMT
|
|
|
|
Post by gridley on Nov 8, 2023 12:27:58 GMT
Looking at the tall tower on the right I immediately thought "Orthanc"... |
|
|
|
Post by missouriboy on Nov 8, 2023 16:03:23 GMT
Find of the year Sig.  Any contacts for this guy? And the 2019 paper he mentions? Answer to my question ... partial from a search for Mike Wallace hydrologist at DuckDuckGo Sandia National Laboratories - I can find him.
From the wattsupwiththat paper  |
|
|
|
Post by blustnmtn on Nov 9, 2023 13:44:47 GMT
This Nic Lewis essay is from JC's website: judithcurry.com/2023/11/06/hansens-latest-overheated-global-warming-claims-are-based-on-bad-science/"James Hansen’s latest paper “Global warming in the pipeline” (Hansen et al. (2023)) has already been heavily criticized in a lengthy comment by Michael Mann, author of the original IPCC ‘hockey stick’. However Mann does not deal with Hansen’s surprisingly high (4.8°C) new estimate of equilibrium climate sensitivity (ECS)[1]. This ECS estimate is 60% above Hansen’s longstanding[2] previous estimate of 3°C. It is Hansen’s new, very high ECS estimate drives, in conjunction with various questionable subsidiary assumptions, his paper’s dire predictions of high global warming and its more extreme concluding policy recommendations, such as ‘solar radiation management’ geoengineering. Hansen’s new 4.8°C ECS estimate is well above the best estimate of 3°C reached in the IPCC’s latest scientific assessment report (AR6), lies outside the AR6 likely (66%) range of 2.5–4°C and is almost at the top of the AR6 90% uncertainty range of 2–5°C.[3]" When Michael "Hockey Stick Mann" criticizes your methods for predicting burning earth, you must be really out there! |
|
|
|
Post by douglavers on Nov 11, 2023 21:59:10 GMT
Apparently, auroras are going to be visible as far South as UK Birmingham this weekend, due to another large CME.
This must follpw the weakening of the planetary magnetic field, which has been known to be diminishing over the last decades.
Does anyone know where a graph of this weakening can be found?
I have a sort of suspicion that this info is being suppressed, as the prospect of an imminent flip of the poles should terrify anyone who thinks about it.
|
|
|
|
Post by ratty on Nov 11, 2023 23:26:44 GMT
Apparently, auroras are going to be visible as far South as UK Birmingham this weekend, due to another large CME. This must follow the weakening of the planetary magnetic field, which has been known to be diminishing over the last decades. Does anyone know where a graph of this weakening can be found? I have a sort of suspicion that this info is being suppressed, as the prospect of an imminent flip of the poles should terrify anyone who thinks about it. Maybe start here: Magnetosphere Graph TutorialFrom another place: " For example, we know that over the past 200 years, the magnetic field has weakened about 9 percent on a global average. However, paleomagnetic studies show the field is actually about the strongest it’s been in the past 100,000 years, and is twice as intense as its million-year average." |
|
|
|
Post by flearider on Nov 12, 2023 7:38:22 GMT
Apparently, auroras are going to be visible as far South as UK Birmingham this weekend, due to another large CME. This must follow the weakening of the planetary magnetic field, which has been known to be diminishing over the last decades. Does anyone know where a graph of this weakening can be found? I have a sort of suspicion that this info is being suppressed, as the prospect of an imminent flip of the poles should terrify anyone who thinks about it. Maybe start here: Magnetosphere Graph TutorialFrom another place: " For example, we know that over the past 200 years, the magnetic field has weakened about 9 percent on a global average. However, paleomagnetic studies show the field is actually about the strongest it’s been in the past 100,000 years, and is twice as intense as its million-year average." 9% your a little behind more like 18-23% and it's speeding up .. they recon between 2035-2045 it will flip ... i've got popcorn rdy for that one .. if i'm still here .. |
|