|
|
Post by blustnmtn on Sept 12, 2021 19:30:54 GMT
|
|
|
|
Post by neilhamp on Sept 13, 2021 6:35:49 GMT
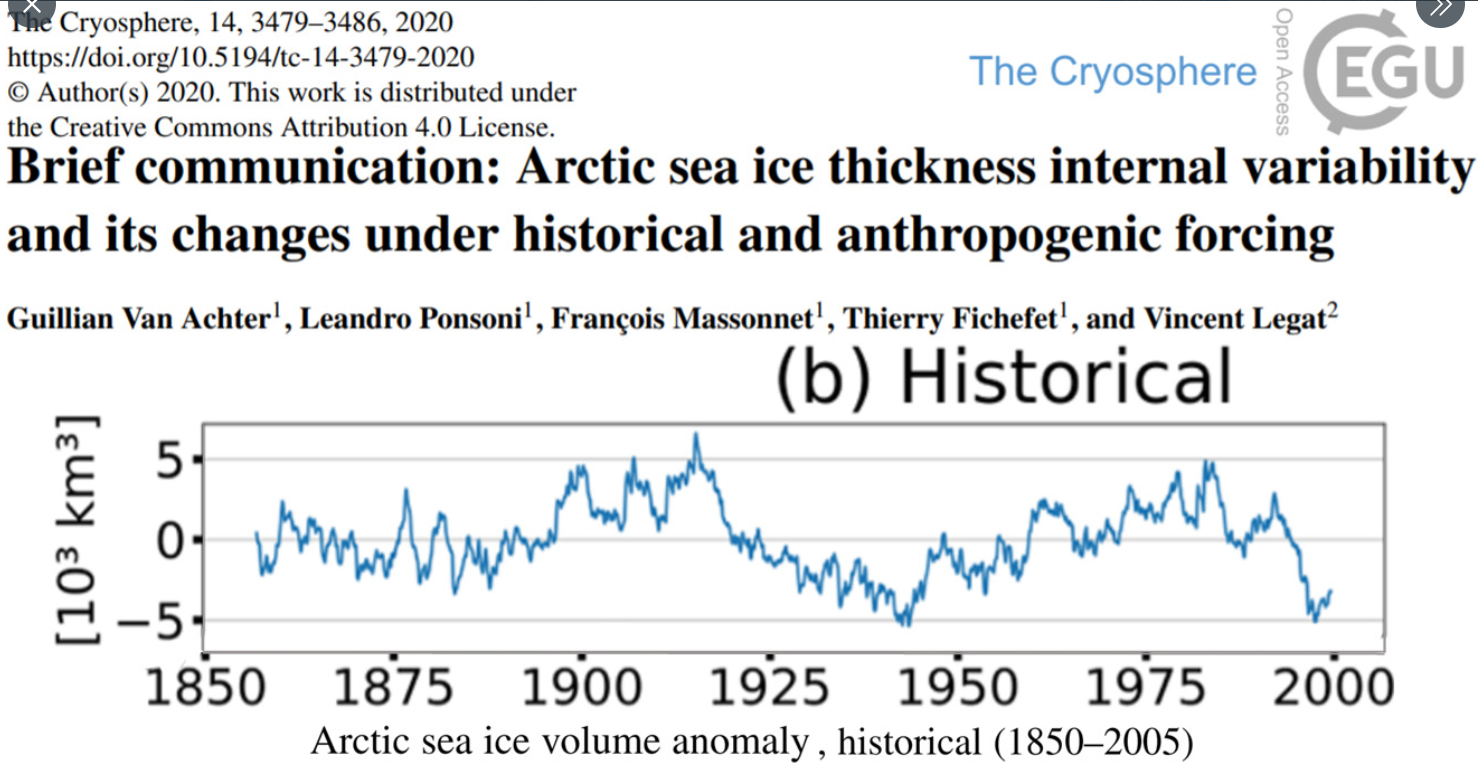
Does any one know anything about this chart displayed on NoTrickZone How can they estimate sea ice thickness back beyond satellite data? Sorry about the picture size. How can I make it smaller?  |
|
|
|
Post by blustnmtn on Sept 13, 2021 10:58:03 GMT
Does any one know anything about this chart displayed on NoTrickZone How can they estimate sea ice thickness back beyond satellite data? Sorry about the picture size. How can I make it smaller?  Good question. I was thinking ships logs which were very weather centered. Remember, the search for a Northwest Passage was a top priority for all of the maritime powers! I found this: phys.org/news/2019-08-century-arctic-sea-ice-volume.html |
|
|
|
Post by nonentropic on Sept 13, 2021 18:30:37 GMT
Interesting Blus, contradicts the above very strongly.
I trust the satellite period but little else. there is little doubt the period up to the 50's were low and the older data that was use to build the above or the other would be very open to interpretation.
Open water behind ice is a feature of modern observations from satellite at the end of the summer season.
|
|
|
|
Post by blustnmtn on Sept 13, 2021 19:48:50 GMT
Interesting Blus, contradicts the above very strongly. I trust the satellite period but little else. there is little doubt the period up to the 50's were low and the older data that was use to build the above or the other would be very open to interpretation. Open water behind ice is a feature of modern observations from satellite at the end of the summer season. No matter what chart we look at, they all represent an extremely short temporal record of the ice. The LIA alone must have caused an increased sea ice extent compared to today that has since declined. |
|
|
|
Post by blustnmtn on Sept 17, 2021 15:36:15 GMT
|
|
|
|
Post by missouriboy on Sept 17, 2021 17:58:51 GMT
The big ones are select La Nina years. |
|
|
|
Post by phydeaux2363 on Sept 22, 2021 21:23:54 GMT
Looks like Arctic ice extent has passed its 2021 minimum. Another year, another non-ice free Arctic. sunshinehours.net/ |
|
|
|
Post by phydeaux2363 on Oct 1, 2021 17:10:50 GMT
So, ten years had lower Arctic Ice Extent than 2021 according to sunshinehours. Does this mean the cryosphere is no longer writhing in agony?
|
|
|
|
Post by neilhamp on Oct 9, 2021 18:59:44 GMT
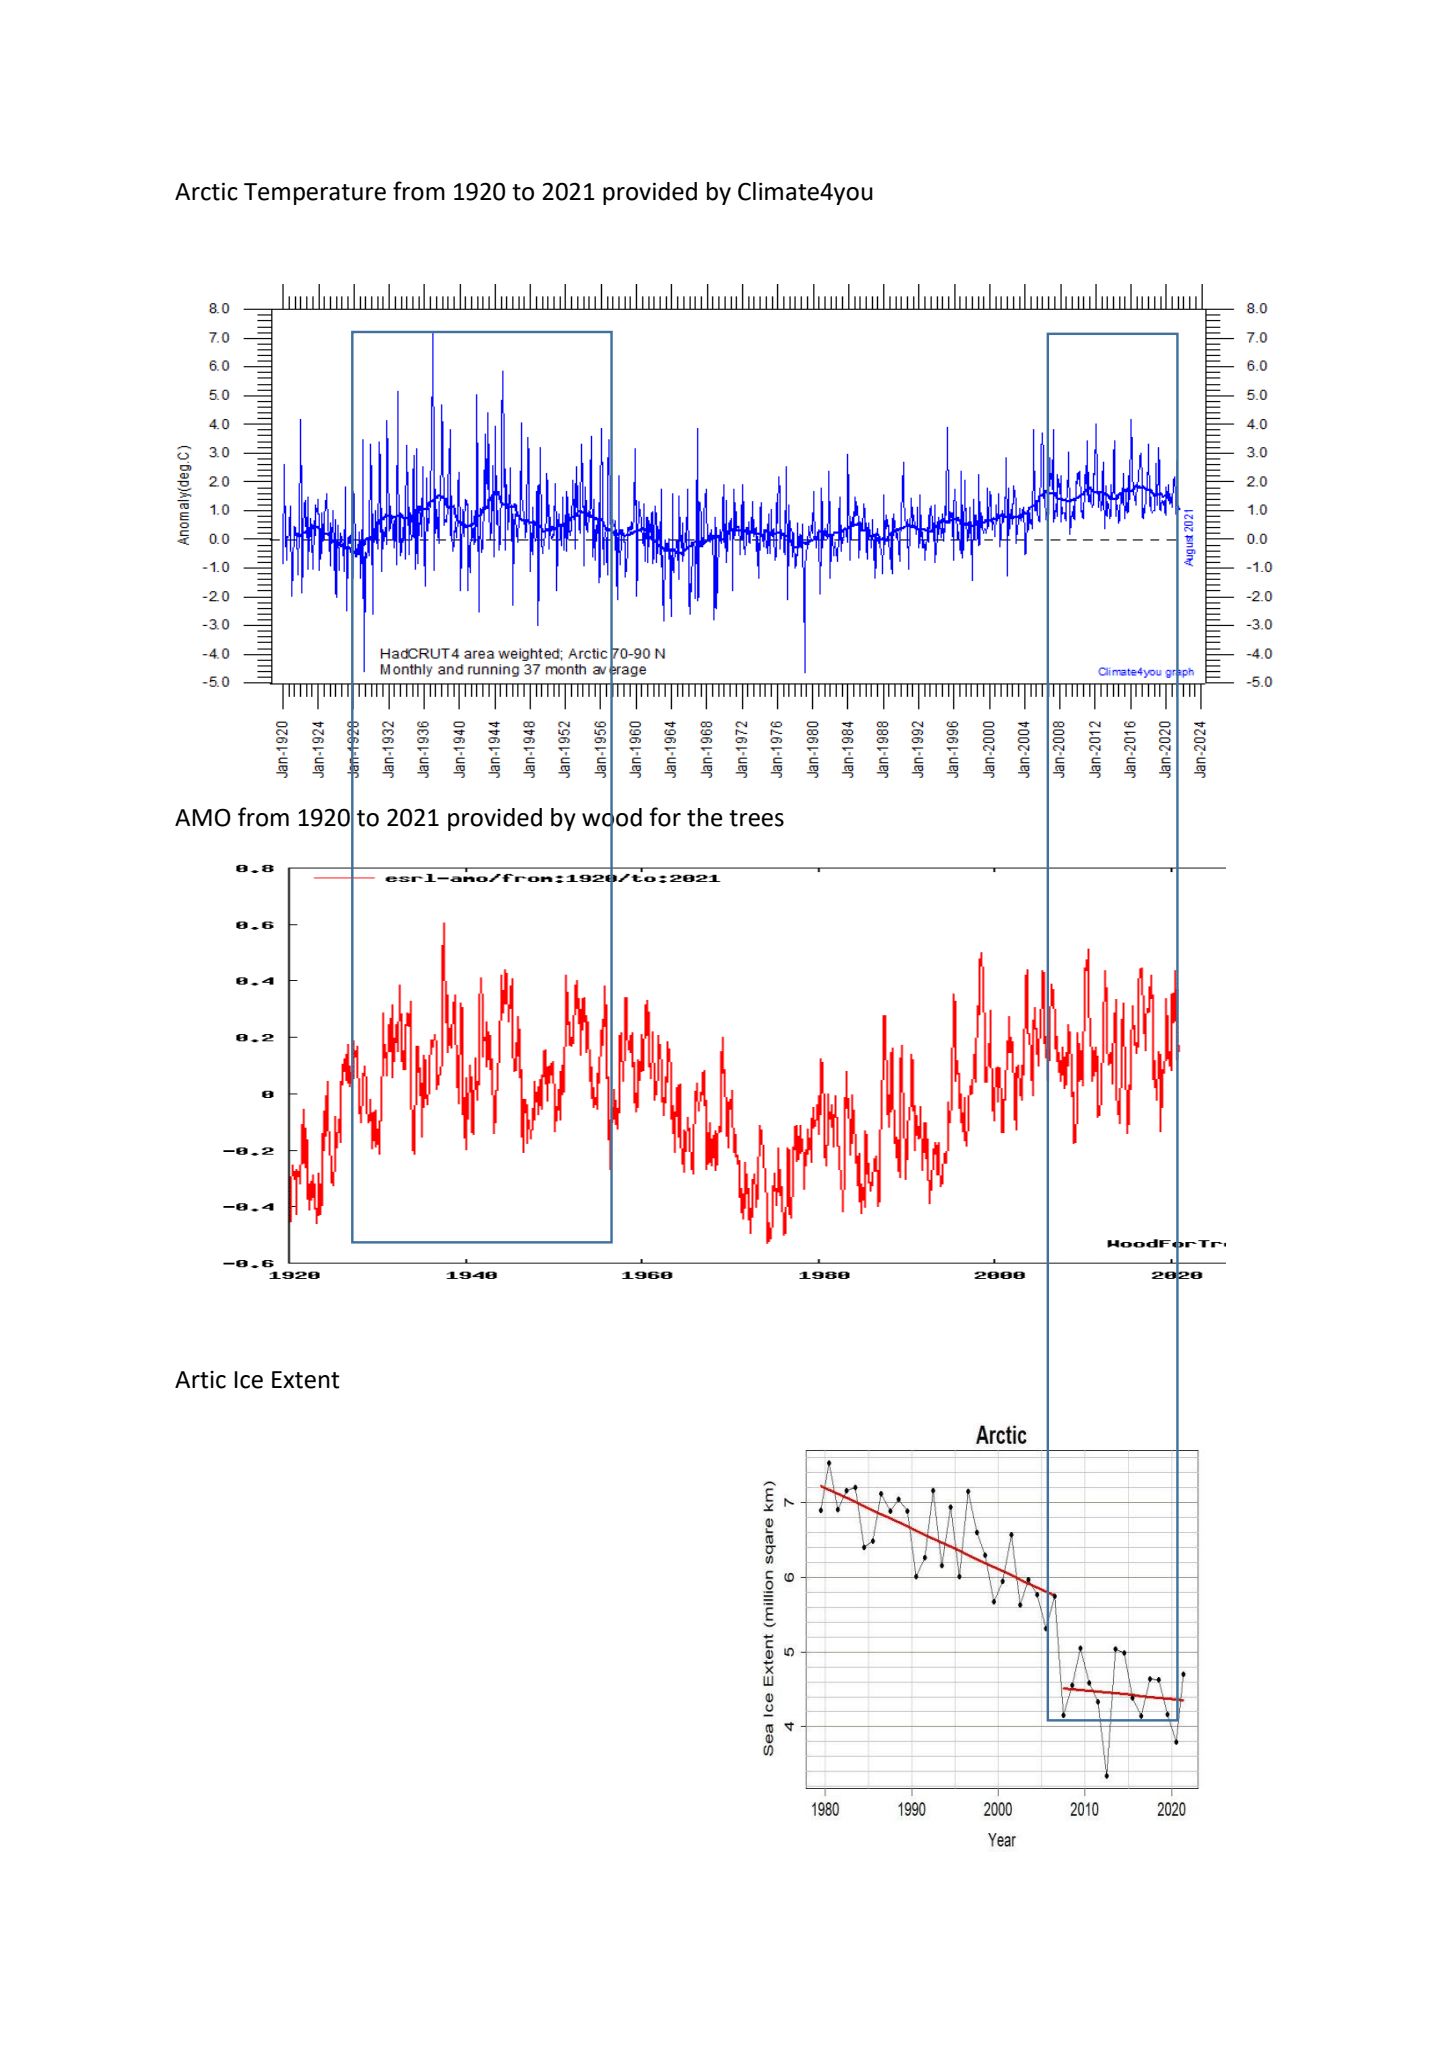
Arctic temperatures seem to be exhibiting a slight pause. The graph below shows Artic temperatures from 1920 to 2021 The AMO chart for the same period is also shown below. The periods of Maximum AMO have been boxed out. They would appear to be linked to a corresponding rise in Arctic temperatures. If this is true we might expect to see Arctic temperatures falling as the AMO starts to fall. We can only wait and see. The Sea Ice extend is shown in the last graph. It appears to have bottomed out since 2007 But we only have 14 years of data. There was a big recovery in sea ice in 2021. Will this continue in 2022 if the AMO starts to fall? Again we will have to wait and see   |
|
|
|
Post by missouriboy on Nov 13, 2021 6:14:43 GMT
|
|
|
|
Post by ratty on Nov 13, 2021 11:56:20 GMT
|
|
|
|
Post by phydeaux2363 on Nov 14, 2021 16:08:43 GMT
Where's Mr. Graywolf when you need him? |
|
|
|
Post by walnut on Nov 14, 2021 16:26:19 GMT
Where's Mr. Graywolf when you need him? Yeah, it's like where are the Oklahoma and Texas U football fans today? |
|
|
|
Post by missouriboy on Nov 14, 2021 18:58:07 GMT
Vladamir is just quoting HR Haldeman, who was quoting Teddy. “If you've got them by the balls, their hearts and minds will follow.”  |
|