|
|
Post by ratty on Aug 26, 2021 3:45:48 GMT
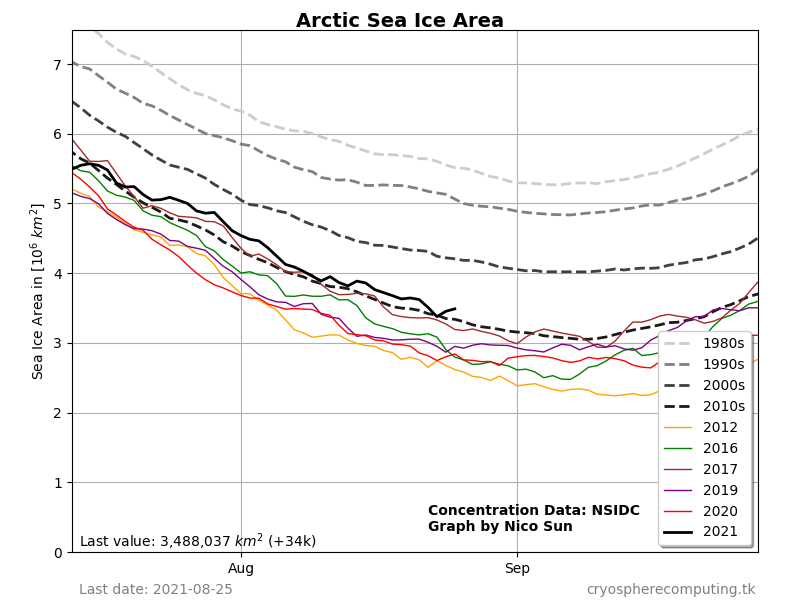
Arctic sea ice extent should be nearing or at minimum in about two weeks, no, Mr.Neil? Both extent and area in the Arctic look good atm. Best in many years? |
|
|
|
Post by neilhamp on Aug 26, 2021 7:29:41 GMT
Sea Ice in 2020 showed two rapid downturns in mid July and mid August.
So far this year, this does not seem to have occurred.
Can anyone explain why?
|
|
|
|
Post by acidohm on Aug 26, 2021 9:02:33 GMT
Sea Ice in 2020 showed two rapid downturns in mid July and mid August. So far this year, this does not seem to have occurred. Can anyone explain why? Ice extent is 15% ice or more, alot of it is ice floes. Wind easily spreads or compacts the floes. Last year's arctic temps..  |
|
|
|
Post by ufasuperstorm on Aug 26, 2021 15:09:05 GMT
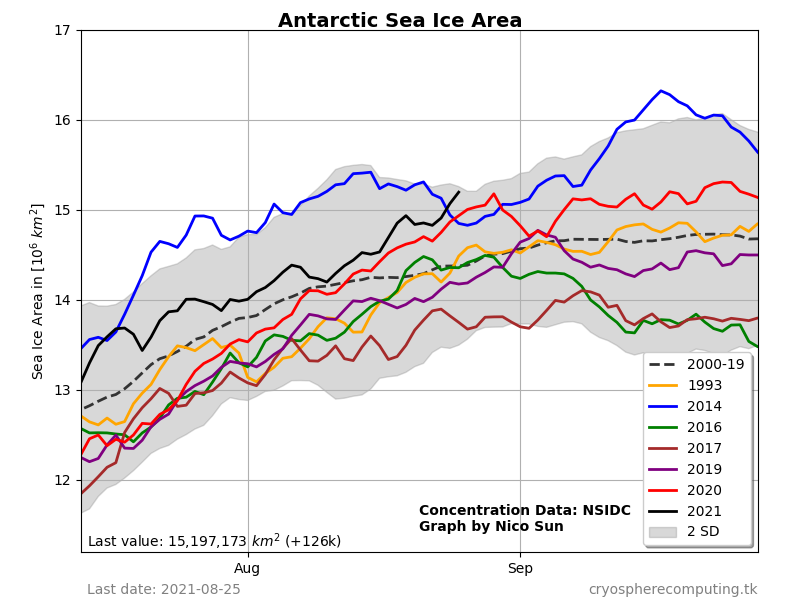
NSIDC daily area minimum will most likely be 8.23.2021, with a value of 3.389173 million square kilometers. The 8.25 value is 3.501343 millions of square kilometers. We are now 112,170 kilometers above the minimum value. This would be the earliest daily area minimum in the satellite record. Bear witness to history.  Meanwhile, Southern hemisphere sea ice area is approaching the all time high.  The NSIDC sea ice extent value for 8.25, is higher than the 8.23 value. Many point to the 2007 melting season as the year the arctic changed. If one were to hypothesize a sea ice recovery to pre 2007 levels, 2021 could be looked at in the same light. 2020 was the second lowest sea ice extent northern hemisphere sea ice minimum on record. If we end 2021 in 15th place, this would be the largest place year to year difference on record. |
|
|
|
Post by duwayne on Aug 26, 2021 18:00:52 GMT
Can we make a "hockey stick" graph from the recent ice data?
|
|
|
|
Post by ratty on Aug 28, 2021 10:41:03 GMT
Can we make a "hockey stick" graph from the recent ice data? According to Mann's Law, all data input produces a hockey stick.  |
|
|
|
Post by missouriboy on Aug 28, 2021 14:34:17 GMT
Can we make a "hockey stick" graph from the recent ice data? According to Mann's Law, all data input produces a hockey stick.  Michael's degree was earned at Puck U, also affectionately abbreviated as PU. Their hockey team is well known, and performs best in places where the sun don't shine. |
|
|
|
Post by walnut on Aug 28, 2021 14:43:54 GMT
Chart still looks good for arctic ice extent. But it can go south fast though. Look at 2012. I remember terrible heat in the central US in 2013 and 2014. Not that they are meaningfully related .
|
|
|
|
Post by blustnmtn on Sept 4, 2021 15:44:57 GMT
|
|
|
|
Post by acidohm on Sept 10, 2021 5:02:51 GMT
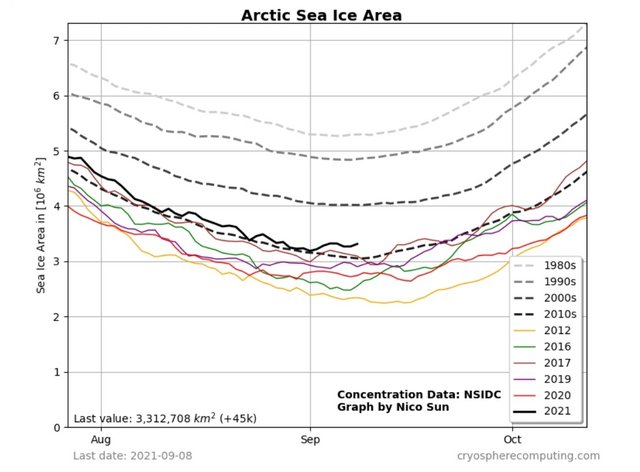
That was probably minimum extent on Sept 1st?  |
|
|
|
Post by acidohm on Sept 11, 2021 5:00:01 GMT
Sea Ice in 2020 showed two rapid downturns in mid July and mid August. So far this year, this does not seem to have occurred. Can anyone explain why? This may be of interest Neil?? nsidc.org/arcticseaicenews/ |
|
|
|
Post by blustnmtn on Sept 11, 2021 15:24:39 GMT
|
|
|
|
Post by duwayne on Sept 12, 2021 18:10:56 GMT
"Scientists Now Blame Geothermal Heat For Melting Antarctic Glaciers"
|
|
|
|
Post by Sigurdur on Sept 12, 2021 18:17:15 GMT
"Scientists Now Blame Geothermal Heat For Melting Antarctic Glaciers"
Took them long enough. Most active members on this board have recognized this for over a decade. |
|
|
|
Post by missouriboy on Sept 12, 2021 18:58:12 GMT
"Scientists Now Blame Geothermal Heat For Melting Antarctic Glaciers"
Took them long enough. Most active members on this board have recognized this for over a decade. "There are none so blind as those who will not see."  I have also wondered for some time whether the persistence of heat in the northern part of the NAD has something to do with geothermal activity. In general, we have seen volcanism increase in the on-going solar downturn. The North Atlantic "cold spot" that accumulated some years back has been blamed by some on ice melting. Currently warming seems to be underway in the same areas. Is there a geothermal source? |
|