|
|
Post by neilhamp on May 10, 2022 5:39:22 GMT
Report from PIOMAS just updated for April psc.apl.uw.edu/research/projects/arctic-sea-ice-volume-anomaly/ "The April time series (Fig 8) for both data sets have no apparent trend over the past 11 years. Comparing this with the 43 year 1979-2022 time series highlights the importance of natural variability in relatively short time series such as currently available from CS2. Both records show close match in magnitude and similar temporal variability." See also my update of current sea ice extent below |
|
|
|
Post by neilhamp on May 26, 2022 19:39:49 GMT
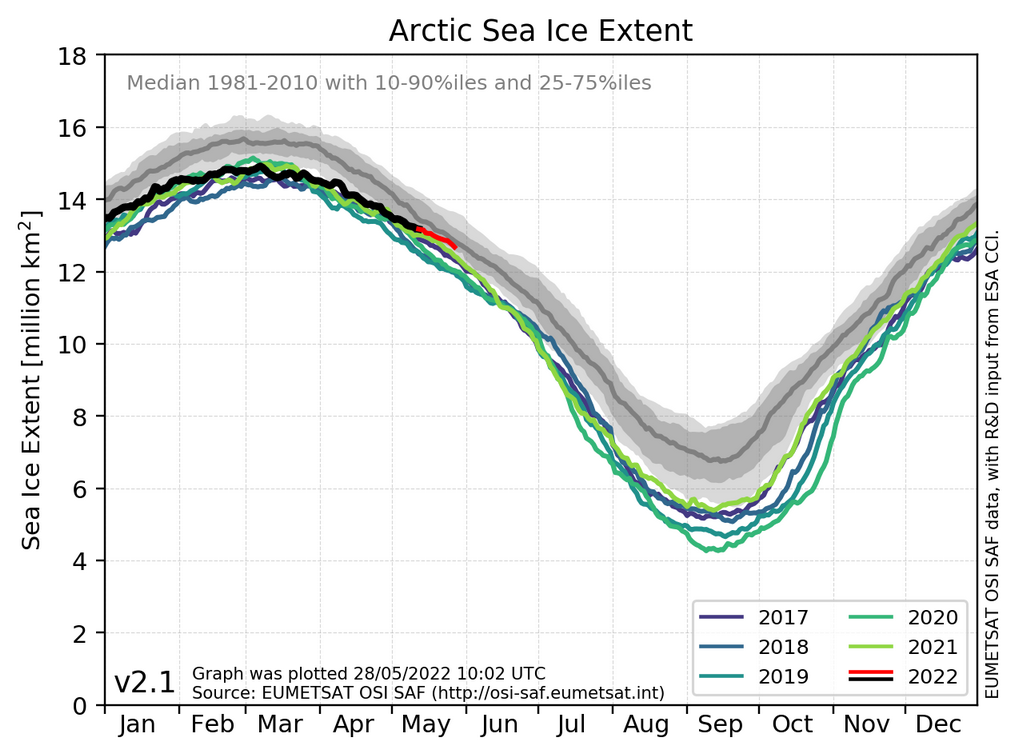
In March the sea ice dropped BELOW the 2010's average for the first time since August 2021!
By the end of April the sea ice extent had risen back ABOVE the 2010's average.
Since August 2021, March is the ONLY MONTH in which the sea ice extent has fallen below the average for the 2010's decade.
| Month | 2021 | 2021 | 2022 | 2022 |
| Position | Difference from 2010's avge. | Position | Difference from 2010's avge. |
|
|
|
|
| | Jan.31st. | 7th. lowest | +79,452 sq.km. ABOVE 2010's avge. | 16th.lowest | +333,064 sq.km. ABOVE 2010's avge. | | Feb.28th. | 7th. lowest | -161,829 sq.km below 2010's avge. | 11th.lowest | +116,764 sq.km. ABOVE 2010's avge. | | Mar.31st. | 6th. lowest | -296,133 sq.km below 2010's avge. | 10th.lowest | -127,470 sq.km. below 2010's avge. | | Apr.30th | 9th. lowest | +1,632 sq.km ABOVE 2010's avge. | 10th.lowest | +16,886 sq.km. ABOVE 2010's avge. | | May.31st. | 7th. lowest | +64,174 sq.km. ABOVE 2010's avge. | 15th.lowest | +395,097 sq.km. ABOVE 2010's avge. | | Jun.30th. | 6th. lowest | -119,772 sq.km. below 2010's avge. | 10th.lowest | +35,744 sq.km. ABOVE 2010's avge. |
June 2022 sea ice has been well BELOW the 2010's average for the last two weeks of June (dotted line).
Just edged back ABOVE 2010's average at month end?

|
|
|
|
Post by youngjasper on May 26, 2022 22:19:53 GMT
|
|
|
|
Post by neilhamp on May 28, 2022 6:14:15 GMT
Great chart youngjasper.
Fantastic work you have done on the VISHOP chart.
Nice simplification of their chart!
Good illustration of what is actually happening up in the Artic.
Will the trend continue through June and July?
|
|
|
|
Post by youngjasper on May 28, 2022 21:04:06 GMT
Thanks, Neil. As for the trend for June and July: It truly depends on the temp of the water flowing into the Arctic in my opinion. We've got a strong and large la nina going, but sea surface temp anomalies in the northern oceans look warm with a bit of an area in the N Atlantic showing cool. I don't believe we'll pull another 2012 for sure. At least the 2022 line is trying to kiss that 2000s average right now. Let's see if it manages to do so.
|
|
|
|
Post by ratty on May 29, 2022 0:26:10 GMT
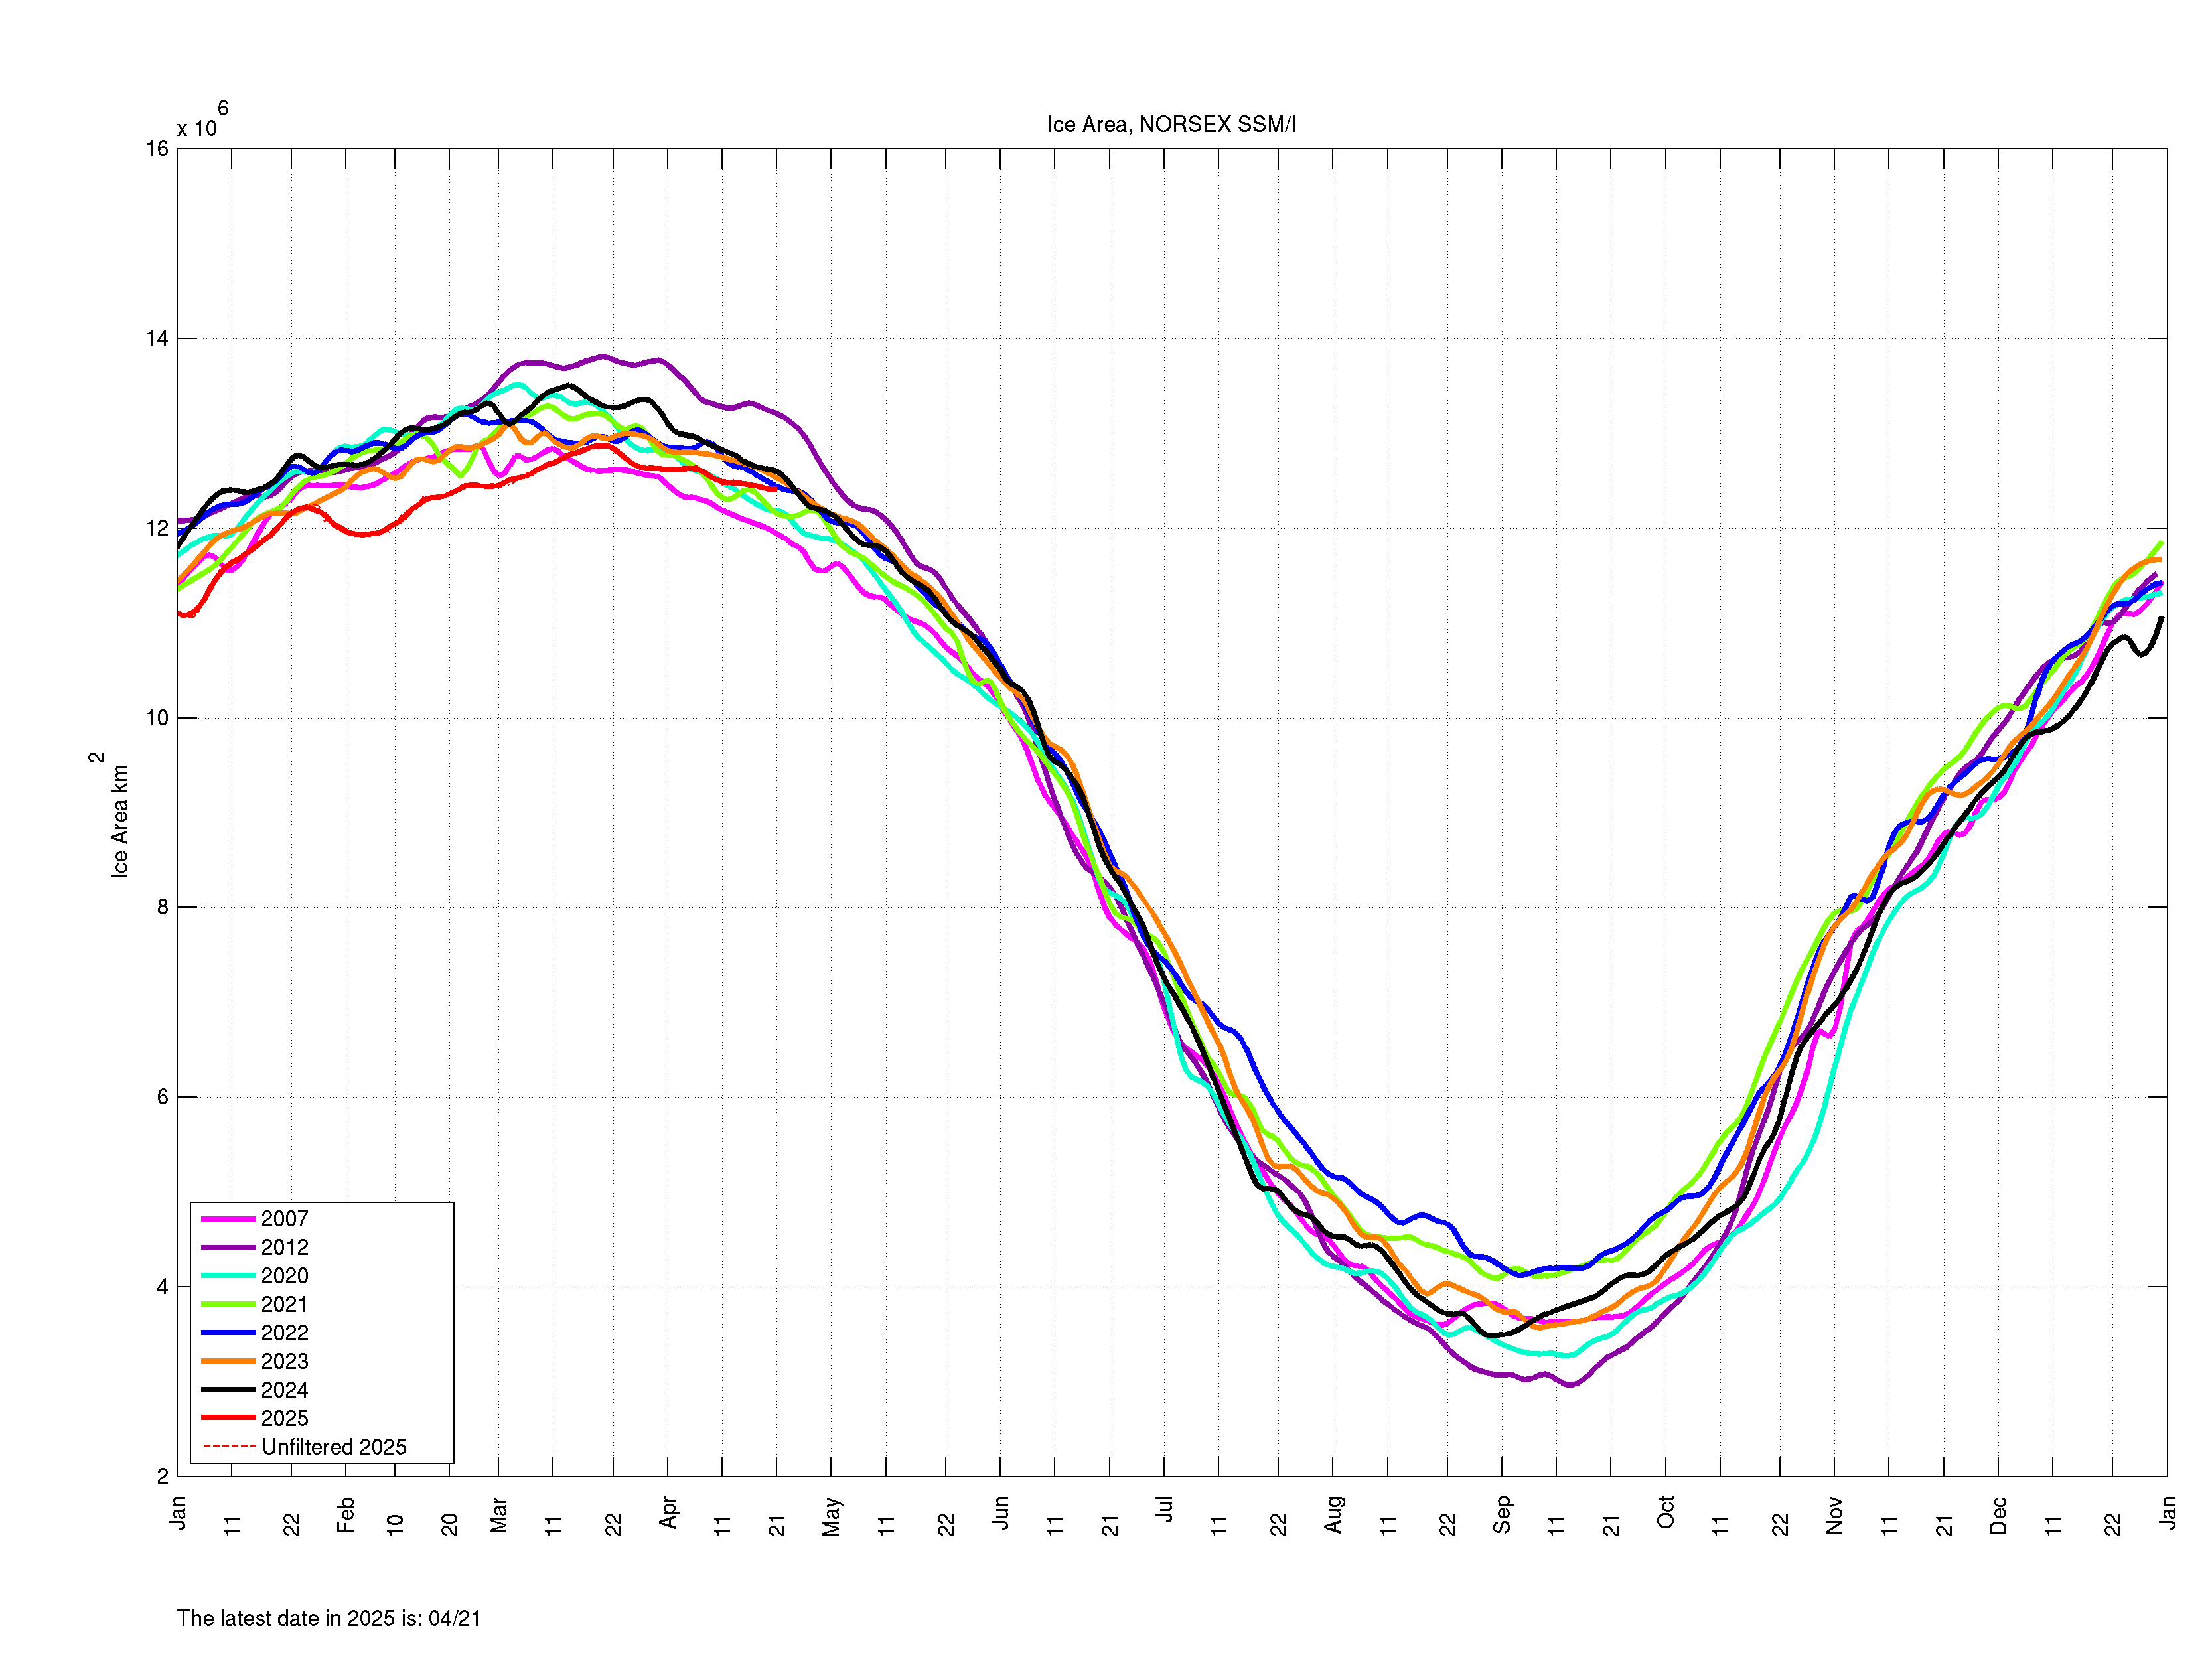
Thanks, Neil. As for the trend for June and July: It truly depends on the temp of the water flowing into the Arctic in my opinion. We've got a strong and large la nina going, but sea surface temp anomalies in the northern oceans look warm with a bit of an area in the N Atlantic showing cool. I don't believe we'll pull another 2012 for sure. At least the 2022 line is trying to kiss that 2000s average right now. Let's see if it manages to do so. DMI:  Area holding up too ...  |
|
|
|
Post by youngjasper on May 31, 2022 0:53:55 GMT
On the area graph that Ratty posted: Note the hump of 2012 (lowest year) at the first part of April looks pretty good (and 2022 is actually kissing 2013 there) relative to the other years posted, yet 2012 is the lowest year by mid-Sept. That is the issue of what I tend to do, which is wiggle watching. Clearly there was something about the critical months of summer in 2012 that caused the precipitous dip. I am a believer in the transport of warmer water, yet I do not know what drives that or if it in fact comes from geologic activity below or both. This year will be interesting to see where we end up for the low in Sept. Bring it on.
|
|
|
|
Post by missouriboy on May 31, 2022 2:42:59 GMT
On the area graph that Ratty posted: Note the hump of 2012 (lowest year) at the first part of April looks pretty good (and 2022 is actually kissing 2013 there) relative to the other years posted, yet 2012 is the lowest year by mid-Sept. That is the issue of what I tend to do, which is wiggle watching. Clearly there was something about the critical months of summer in 2012 that caused the precipitous dip. I am a believer in the transport of warmer water, yet I do not know what drives that or if it in fact comes from geologic activity below or both. This year will be interesting to see where we end up for the low in Sept. Bring it on. David Dilley ( www.globalweatheroscillations.com/david-dilley ) postulates that it is lunar gravitation forces. These have recently been postulated as drivers for ENSO waves as well. Ice in 2012 shows both high in winter-spring and lower in summer. A greater range than other years. The ENSO wave has been noted to have similar ranges in amplitude.
|
|
|
|
Post by ratty on May 31, 2022 6:28:50 GMT
On the area graph that Ratty posted: Note the hump of 2012 (lowest year) at the first part of April looks pretty good (and 2022 is actually kissing 2013 there) relative to the other years posted, yet 2012 is the lowest year by mid-Sept. That is the issue of what I tend to do, which is wiggle watching. Clearly there was something about the critical months of summer in 2012 that caused the precipitous dip. I am a believer in the transport of warmer water, yet I do not know what drives that or if it in fact comes from geologic activity below or both. This year will be interesting to see where we end up for the low in Sept. Bring it on. David Dilley ( www.globalweatheroscillations.com/david-dilley ) postulates that it is lunar gravitation forces. These have recently been postulated as drivers for ENSO waves as well. Ice in 2012 shows both high in winter-spring and lower in summer. A greater range than other years. The ENSO wave has been noted to have similar ranges in amplitude. I think the low extent in 2012 was put down to a polar cyclone. The great Arctic cyclone of August 2012Then came Sandy in October; it was a great year for a climate alarmist president. |
|
|
|
Post by neilhamp on Jun 3, 2022 6:19:23 GMT
I will keep information through June up to date.
Scroll back to the top of this page to see latest updates.
Sea ice levels now starting to drop!
|
|
|
|
Post by neilhamp on Jun 4, 2022 6:50:05 GMT
PIOMAS Artic Sea Ice Volume shown below. Notice how the volume has risen from the lower quartile to upper quartile over the past 15 years. Lets hope the Artic Sea Ice continues to improve through 2022  |
|
|
|
Post by ratty on Jun 4, 2022 7:33:55 GMT
PIOMAS Artic Sea Ice Volume shown below. Notice how the volume has risen from the lower quartile to upper quartile over the past 15 years. Lets hope the Artic Sea Ice continues to improve through 2022
[ Snip ] Careful what you wish for?  |
|
|
|
Post by neilhamp on Jun 21, 2022 6:24:43 GMT
Sea ice fallen below 2010's average.
See my updated post at the top of this page
|
|
|
|
Post by missouriboy on Jun 21, 2022 8:01:50 GMT
Nice Graph. Buy signal in the market. PIOMAS Artic Sea Ice Volume shown below. Notice how the volume has risen from the lower quartile to upper quartile over the past 15 years. Lets hope the Artic Sea Ice continues to improve through 2022  |
|
|
|
Post by neilhamp on Jul 2, 2022 6:40:31 GMT
In March the sea ice dropped BELOW the 2010's average for the first time since August 2021!
By the end of April the sea ice extent had risen back ABOVE the 2010's average.
Since August 2021, March is the ONLY MONTH in which the month end sea ice extent has fallen below the average for the 2010's decade.
| Month | 2021 | 2021 | 2022 | 2022 |
| Position | Difference from 2010's avge. | Position | Difference from 2010's avge. |
|
| Sq.Km. |
| Sq.Km. | | Jan.31st | 7th.lowest | +79,452 above 2010's avge. | 16th.lowest | +333,064 above 2010's avge | | Feb.28th | 7th.lowest | -161,829 below 2010's avge | 11th.lowest | +116,764 above 2010's avge | | Mar.31st | 6th.lowest | -296,133 below 2010's avge | 10th.lowest | -127,470 below 2010's avge. | | Apr.30th | 9th.lowest | +1,632 above 2010's avge. | 10th.lowest | +16,886 above 2010's avge | | May.31st | 7th.lowest | +64,174 above 2010's avge | 15th.lowest | +395,097 above 2010's avge | | Jun.30th | 6th.lowest | -119,772 below 2010's avge | 10th.lowest | +35,744 above 2010's avge | | Jul.31st/25th. | 5th.lowest | -147,168 below 2010's avge | 12th.lowest | +198,526 above 2010's avge |
The sea ice extent fell BELOW the 2010's average for the last two weeks of June.
It just edged back ABOVE 2010's average at month end (saved by the bell).
Sea ice extent has continue to remain well ABOVE the 2010's average so far in July (dotted line).
Looks like the trend continues?

|
|