|
|
Post by duwayne on Feb 18, 2023 18:00:18 GMT
COMMENTS/INPUT wanted on the following. Note that cooler surface water flow may have changed directions. Earlier, the colder blue plume was flowing into the the tropical Pacific almost totally from the southeast direction.
That flow now seems to have shut down and is being(?) replaced from along the northeastern Pacific. We saw something very similar at the exact same point in SC24. See map2. Is the cooling north Pacific now being re-cycled into the eastern tropical Pacific? Is this how the North Pacific cools? ... as the cooling western flank of the gyre keeps getting re-cycled? If so, we may not see much of an el-nino bounce in 2023? 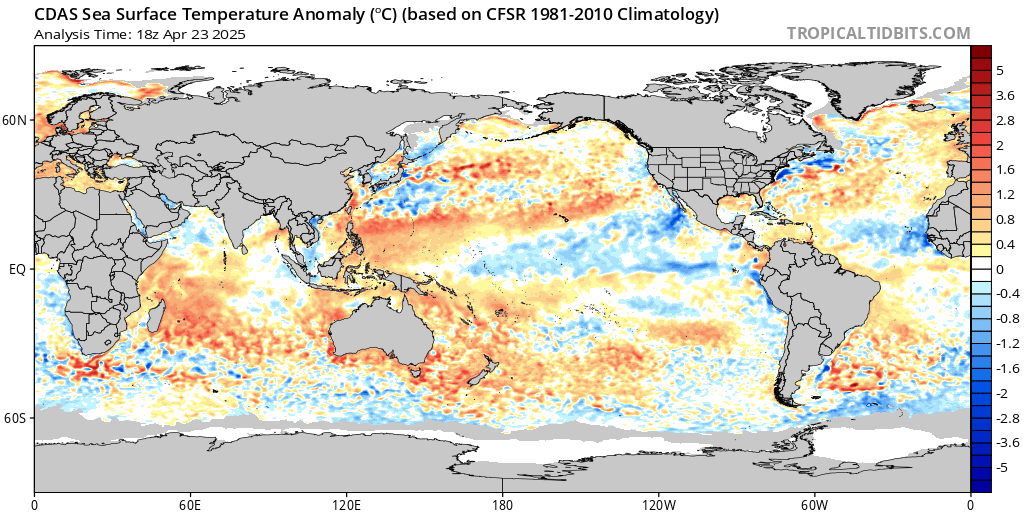 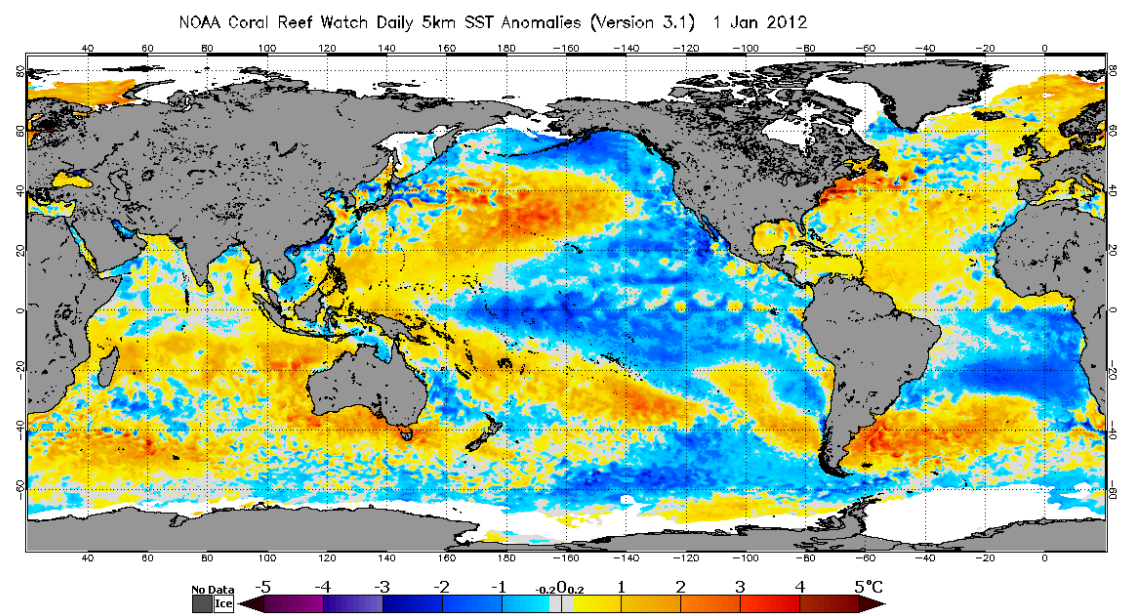 Most Recent 90-day SSTA animation showing shift in cold surface water from the NE. coralreefwatch.noaa.gov/product/5km/ What happened later on in 2012? |
|
|
|
Post by acidohm on Feb 18, 2023 18:04:32 GMT
|
|
|
|
Post by missouriboy on Feb 18, 2023 18:55:35 GMT
Seems to be some classification difference. |
|
|
|
Post by missouriboy on Feb 18, 2023 22:03:41 GMT
COMMENTS/INPUT wanted on the following. Note that cooler surface water flow may have changed directions. Earlier, the colder blue plume was flowing into the the tropical Pacific almost totally from the southeast direction.
That flow now seems to have shut down and is being(?) replaced from along the northeastern Pacific. We saw something very similar at the exact same point in SC24. See map2. Is the cooling north Pacific now being re-cycled into the eastern tropical Pacific? Is this how the North Pacific cools? ... as the cooling western flank of the gyre keeps getting re-cycled? If so, we may not see much of an el-nino bounce in 2023? Note that the February average warm plume in the East appears to be more extensive in 2012 than current. There was NO El Nino after 2009-10 until 2015. coralreefwatch.noaa.gov/product/50km/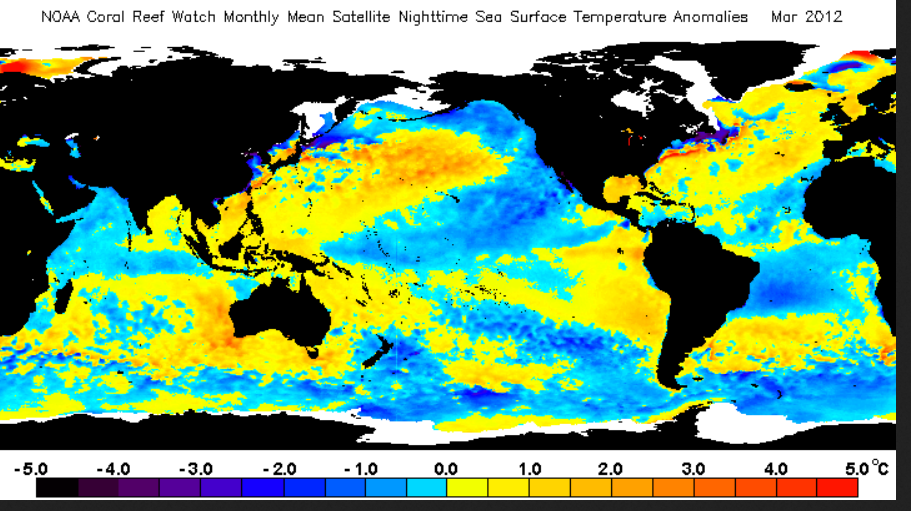 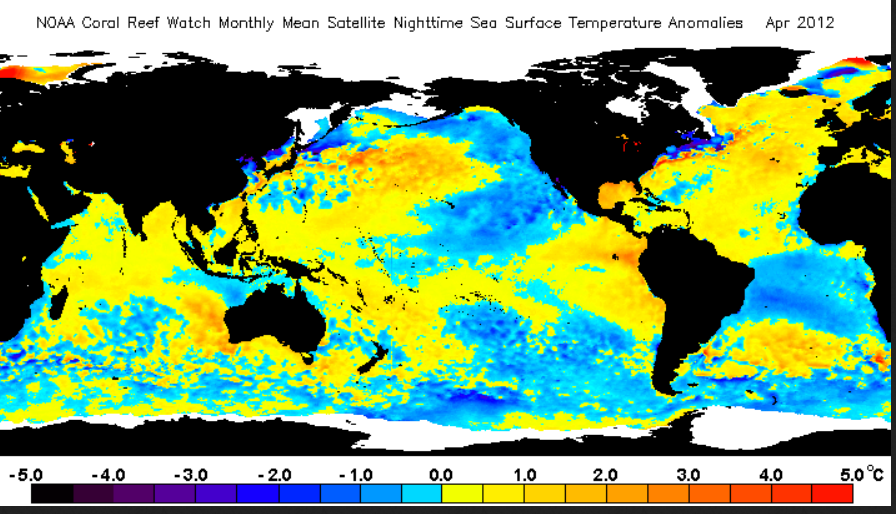 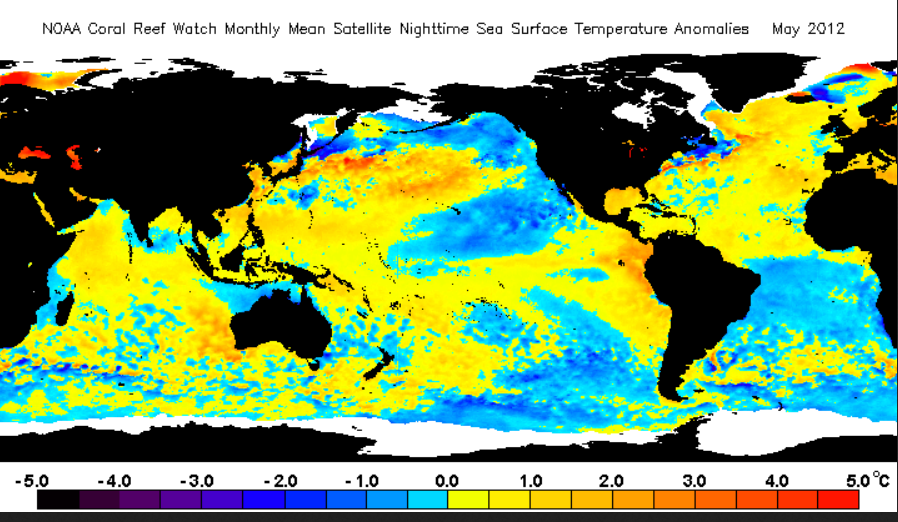 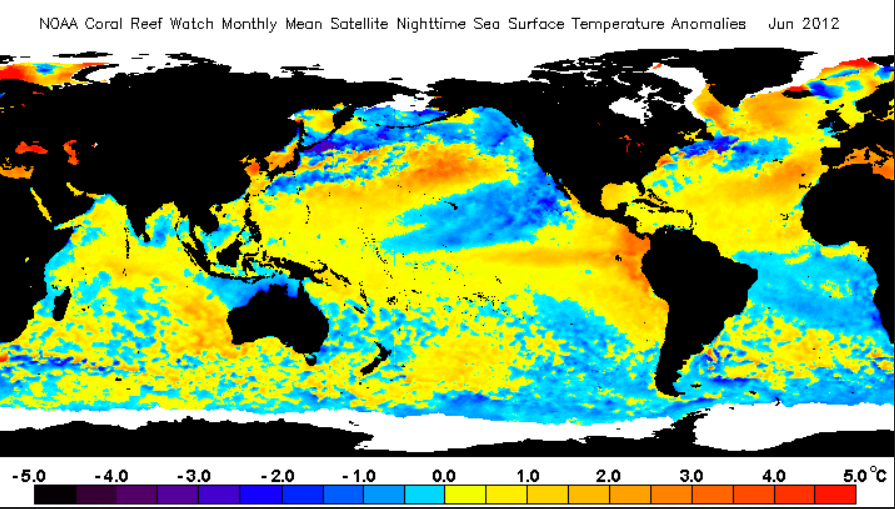 |
|
|
|
Post by acidohm on Feb 18, 2023 22:23:19 GMT
Wasn't 2012 or thereabouts the start of the PNW warm blob? Followed by 2015 Atlantic cold blob (which I have good animation for 😉)
|
|
|
|
Post by missouriboy on Feb 19, 2023 0:04:47 GMT
Wasn't 2012 or thereabouts the start of the PNW warm blob? Followed by 2015 Atlantic cold blob (which I have good animation for 😉) My PDO files show 2015 as the quick high peak in the NE Pacific. I remember people wondering where that came from so quickly. I don't remember any answers. That and the North Atlantic cold blob (2015-16) and people talking about an Beaufort Gyre discharge or Greenland melting. Again ... I don't remember any answers. Oceanic flows may not yet be considered "settled". 
And while we're at it, what the hell is this in early 2015?  |
|
|
|
Post by missouriboy on Feb 25, 2023 18:31:56 GMT
|
|
|
|
Post by duwayne on Feb 26, 2023 0:25:10 GMT
Missouri, did you try the free Microsoft snipping tool? It's not quite as easy as just "stopping" and linking a view, but it will work. The tool will allow you to take a snapshot of a view while it is passing by and save to your pictures file or wherever you designate. Then you will need to load to your dropbox account to enable you to link to Cycle25. |
|
|
|
Post by ratty on Feb 26, 2023 0:48:02 GMT
Here is the Indian-Pacific-Atlantic cross-section (vertical slice)time series of temp anomalies. I need a viewer that I can stop at a particular frame/location to do screen grabs.[ Snip ] Can you not pause it when you're on www.cpc.ncep.noaa.gov/?Naut used to use a screen recording application called MovAvi. |
|
|
|
Post by missouriboy on Mar 2, 2023 0:20:47 GMT
No luck yet. There are freebee gif editors. Just haven't found the time yet.
Those relatively deep plumes (to 1000) both warm and cold show up periodically and move across the sensor fields. May be a lot of Argo in recent years but the older stuff isn't. Vertical up-welling from larger deep sources. Some of the western warm plumes seem to emminate from those hot west volcanic areas. Krackatoa and her sisters blow big time on a semi-regular basis. Is it also a big water heater in between. Where else does a warm water anomaly down deep come from?
Would give a whole new dimension to it. Logically makes it harder for Charles Oscar II to be the primary driver.
|
|
|
|
Post by missouriboy on Mar 5, 2023 22:15:58 GMT
|
|
|
|
Post by ratty on Mar 5, 2023 23:08:34 GMT
Your pay rise has been approved, just awaiting entry in the gazette.  |
|
|
|
Post by duwayne on Mar 6, 2023 19:06:56 GMT
Latest Weekly NINO Region SSTA Deviations timeseries: 1990-2023, 2008-2023 & 2015-2023  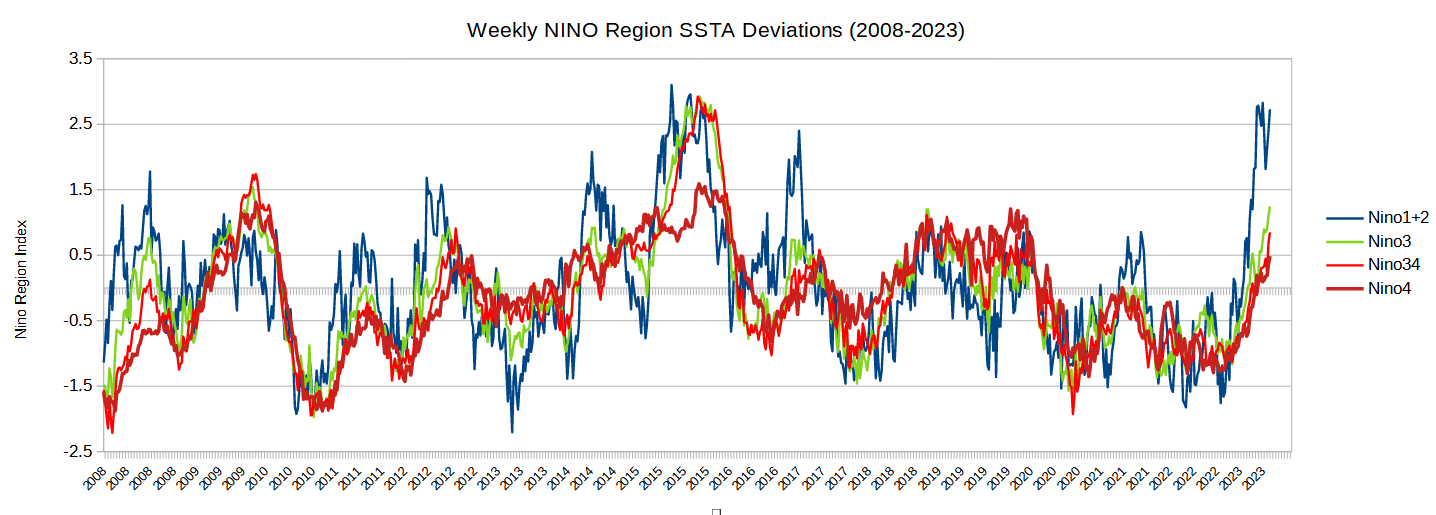 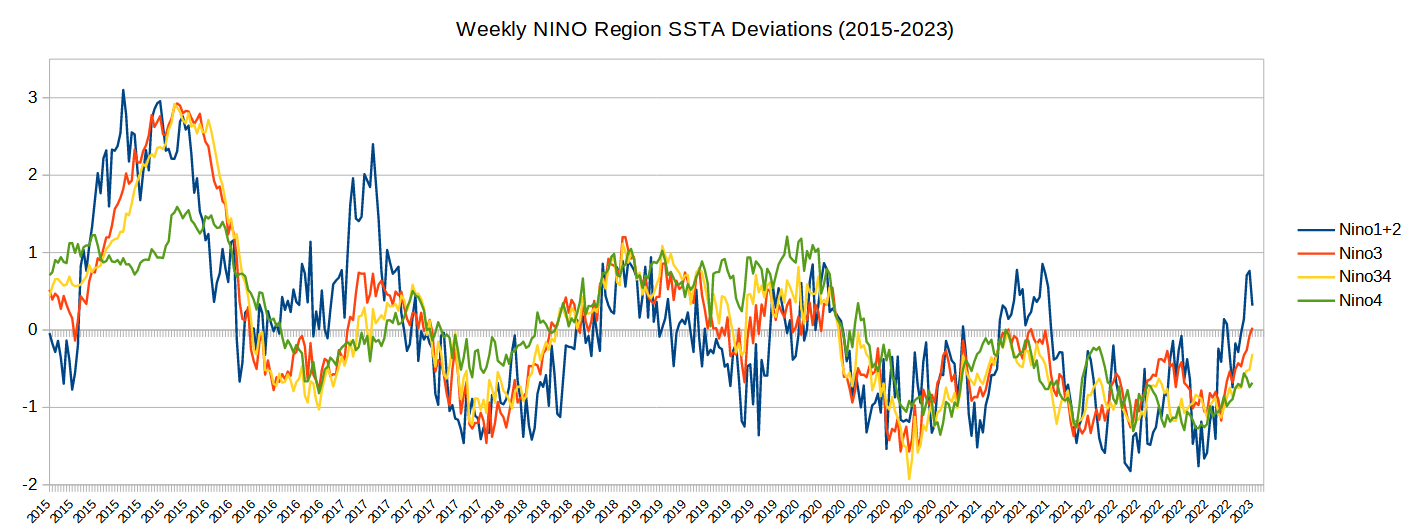 Any predictions for the rest of 2023? |
|
|
|
Post by duwayne on Mar 7, 2023 14:03:19 GMT
The end of the yellow line is our current ENSO3.4 status. 1998 and 2010 were the previous 2 periods which were kicked off by strong La Ninas and were also, like 2020, years associated with new solar cycles.
|
|
|
|
Post by missouriboy on Mar 7, 2023 18:31:36 GMT
The end of the yellow line is our current ENSO3.4 status. 1998 and 2010 were the previous 2 periods which were kicked off by strong La Ninas and were also, like 2020, years associated with new solar cycles.
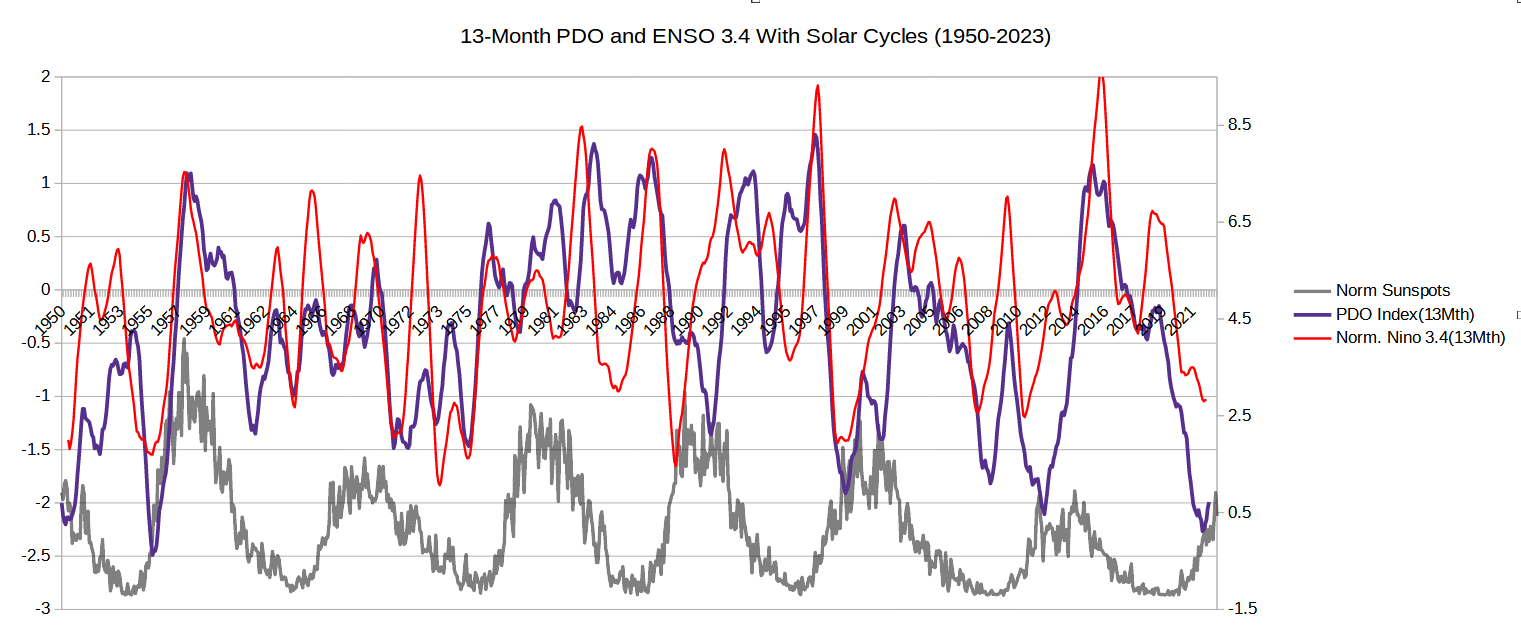
Nice chart. I have come to the conclusion that there are at least two distinct types of El Ninos ... (1) those that precede the sunspot "kickoff" in each solar cycle and (2) those that occur as the the sunspot cycle is declining. Type one seem to originate in the Western Warm Pool from Pacific surface waters that are pushed westward by the tradewinds and warmed by solar radiation on their trip. These are released eastward by gravity waves that surface in the eastern Pacific and move back to the west with the tradewinds, filling in surface column as they progress. The largest of these recent ones occurred at the beginning of SC23. Those at the beginning of SC24 and SC25 were progressively smaller. The chart shows that positive PDOs (accumulation of warmer water in the NE Pacific) occur in conjunction with these pre-cycle ENSO pulses. They have also been progressively less positive from SC23 to SC25. Type Two El Ninos appear to be associated with these warmer waters in the NE Pacific (positive PDO) that cycle back to the tropical Pacific and feed back to the west. These were strong after the SC21, SC22 and SC24 peaks, but not as strong after the SC23 peak. If you look at the monthly SSTA maps that correspond with these post-sunspot-peak periods, you can see the warmer flow merging back into the tropical circulation.
The pre-cycle PDO for SC25 was very small, and I will go out on a limb and forecast that the circulation of warmer NE Pacific water back to the tropics will also be cooler. AND the yellow line in your chart may not end up breaking the +0.5 El-Nino threshold in the later cycle time period. Since UAH tropical troposphere temperature anomalies seem correlated with ENSO SSTAs, I'm suggesting that the troposphere may remain on a cooling trend. I could also be totally wrong. We'll see in about 2 or 3 years.
 |
|