|
|
Post by nonentropic on Jul 24, 2022 3:53:40 GMT
|
|
|
|
Post by nonentropic on Jul 24, 2022 3:54:24 GMT
|
|
|
|
Post by Sigurdur on Jul 24, 2022 4:42:20 GMT
|
|
|
|
Post by code on Jul 24, 2022 15:09:10 GMT
|
|
|
|
Post by missouriboy on Jul 24, 2022 15:11:18 GMT
VERY NICE GRAPH. Where do I get a data time series? And what about that Indian Ocean?
|
|
|
|
Post by missouriboy on Jul 24, 2022 15:18:30 GMT
In the OLD Days there would be talk of God's Judgement. Now we merely say ... "Weather".  |
|
|
|
Post by missouriboy on Jul 24, 2022 18:00:28 GMT
It needs to be edited into easily understood soundbytes (with reference to current climate theology) that political types can understand. Then we can more easily separate the true crooks and morons from the just easily led and confused. Then it could truely be good news for the World. |
|
|
|
Post by duwayne on Jul 24, 2022 18:18:04 GMT
This paper, among other things, notes that the IPCC models have not accurately predicted the cyclical cooling in the ENSO3.4 area over the past several years. This would be consistent with the failure to model accurately for Ocean Currents, particularly upwelling and downwelling. When you mistakenly believe the warming from 1977-2007 was not in part due Ocean Currents and was all due to CO2, you overstate CO2's warming effect and overforecast overall future warming. |
|
|
|
Post by nonentropic on Jul 24, 2022 19:21:48 GMT
The biggest point for me is that the CAGW hypothesis lives or dies on the model outcome that the area within the Hadley cells becomes uninhabitable. If the sea temperature goes up 5C then it would be a reasonable expectation that the plus or minus 30 degrees latitude area would be too warm.
Without that the engine that thaws the Arctic and uninhabitable tropics is gone. A major disappointment for serial headbangers.
|
|
|
|
Post by missouriboy on Jul 28, 2022 4:23:56 GMT
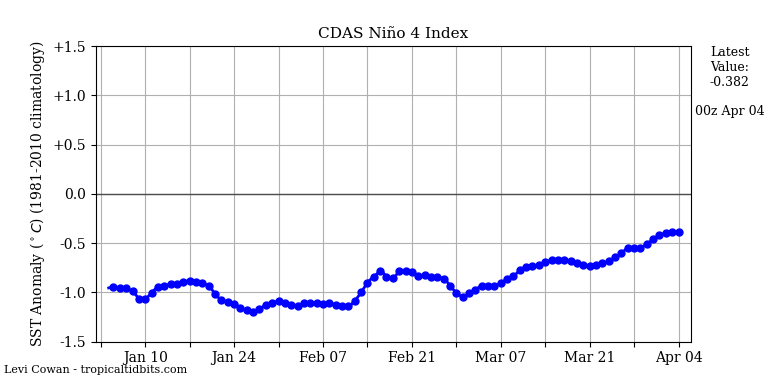
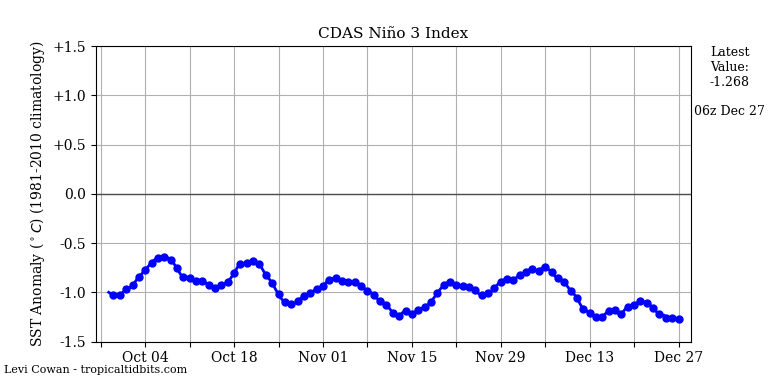
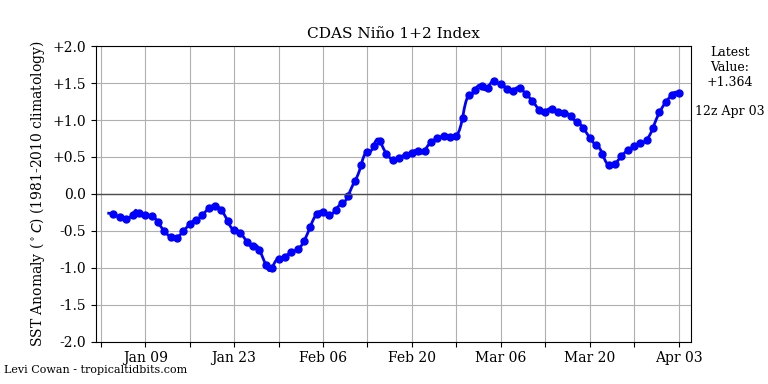
The comparison of the tropical Pacific cross-section SSTAs to the Nino region graphic SSTAs show the story nicely. The latest west-to-east gravity wave sent a lot of warm water east, but it mostly dissipated before surfacing in the Nino 3 region. The Tropical Tidbits timeseries graphs show a small upward pulse in region 3 SSTAs ... but region 1+2 stayed cold AND region 4 got a lot colder. This is as cold as region 4 has been in a long time. Expect Region 4 values to collapse in the July update. This matches the vertical cross-section nicely. As the last of the gravity wave pulse fades, expect region 3 to get colder again? This is how the tropical Pacific cools.
NOW. Is that cold South Pacific water making its way into the equatorial westward flow that will re-circulate into the Western North Pacific?
    [img src="  " alt=" "] |
|
|
|
Post by nonentropic on Jul 28, 2022 18:58:13 GMT
I am sitting here at daybreak in NZ and the sky again is quite red.
This is the situation since the Tongan eruption, sunset is similar.
Nothing in the papers that I have seen. I saw on a site in a comments section, WUWT I think, it was a time series graph of the upper atmospheric MC and it had a clear step change rise on that date I cannot find it again.
|
|
|
|
Post by missouriboy on Jul 28, 2022 20:21:20 GMT
I am sitting here at daybreak in NZ and the sky again is quite red. This is the situation since the Tongan eruption, sunset is similar. Nothing in the papers that I have seen. I saw on a site in a comments section, WUWT I think, it was a time series graph of the upper atmospheric MC and it had a clear step change rise on that date I cannot find it again. I have been updating my weekly timeseries from Tropical Tidbits.
If you find the upper atmospheric MC chart, pass it along. Data file would be better. I hate having to manually input data points.  |
|
|
|
Post by ratty on Jul 29, 2022 1:39:30 GMT
What does Nullschool show?
|
|
|
|
Post by missouriboy on Aug 7, 2022 14:46:03 GMT
The Indo-Pacific Warm Pool |
|
|
|
Post by Sigurdur on Aug 14, 2022 17:33:21 GMT
|
|