|
|
Post by missouriboy on Jan 24, 2022 18:48:31 GMT
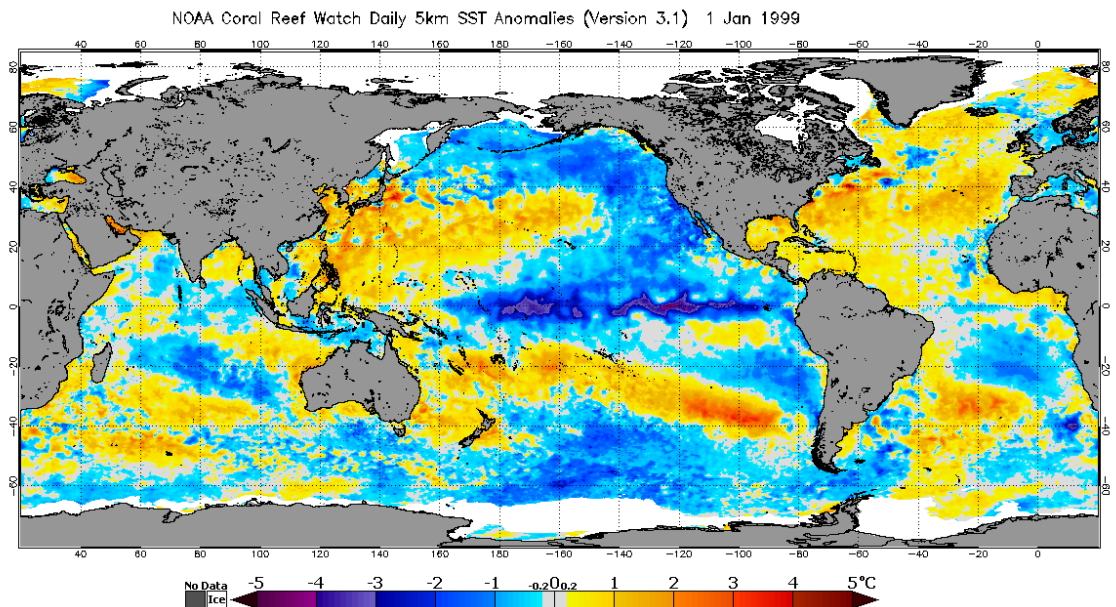
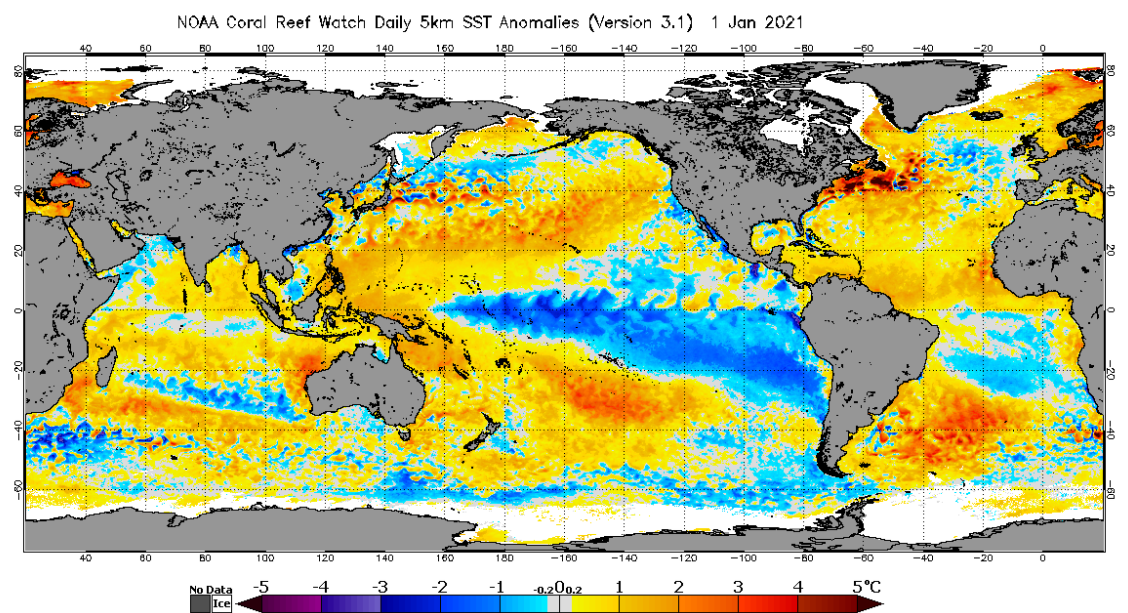
La Ninas from January 1999 and January 2021 - Same distance into the progression. Note that in 1999 most of the cold water was coming in from the North. Note that in 2021 most of the cold water is coming in from the South. Comments? What can we take away from this?   One year later  |
|
|
|
Post by missouriboy on Feb 10, 2022 17:25:25 GMT
The UAH lower troposphere January temperature anomaly just cratered to -0.24 (from 0.03 for December). This value is still shy of the March 2021 first La Nina phase minimum of -0.31 and the early 2011 anomaly for the pre-Cycle 24 La Nina which reached -0.66. February values may provide a better indication (or not) of any Hunga Tonga effects.
|
|
|
|
Post by duwayne on Feb 11, 2022 19:04:58 GMT
The UAH lower troposphere January temperature anomaly just cratered to -0.24 (from 0.03 for December). This value is still shy of the March 2021 first La Nina phase minimum of -0.31 and the early 2011 anomaly for the pre-Cycle 24 La Nina which reached -0.66. February values may provide a better indication (or not) of any Hunga Tonga effects. Missouri, are you referring to the Tropics anomaly? |
|
|
|
Post by missouriboy on Feb 11, 2022 19:12:57 GMT
The UAH lower troposphere January temperature anomaly just cratered to -0.24 (from 0.03 for December). This value is still shy of the March 2021 first La Nina phase minimum of -0.31 and the early 2011 anomaly for the pre-Cycle 24 La Nina which reached -0.66. February values may provide a better indication (or not) of any Hunga Tonga effects. Missouri, are you referring to the Tropics anomaly? Yes. Forgot that key word. The global anomaly dropped to 0.03. |
|
|
|
Post by duwayne on Feb 12, 2022 18:28:00 GMT
La Ninas from January 1999 and January 2021 - Same distance into the progression. Note that in 1999 most of the cold water was coming in from the North. Note that in 2021 most of the cold water is coming in from the South. Comments? What can we take away from this?   One year later  Missouri, you note the difference between the La Nina pattern this year and the prior La Nina which followed the previous Solar minimum. There has been a notable difference between these two La Ninas throughout their existence and even in the months prior. The difference in the pattern in the months prior is why I questioned whether the current La Nina would actually happen. If the Solar minimum was the major driver, shouldn't the patterns look similar prior to the La Ninas? Shouldn't the La Ninas be quite similar?
As it turned out your La Nina prediction was correct with respect to the sea surface temperatures in the ENSO3.4 area which define a La Nina so there is some added evidence for the Solar Minimum driving force.
|
|
|
|
Post by nonentropic on Feb 12, 2022 19:27:38 GMT
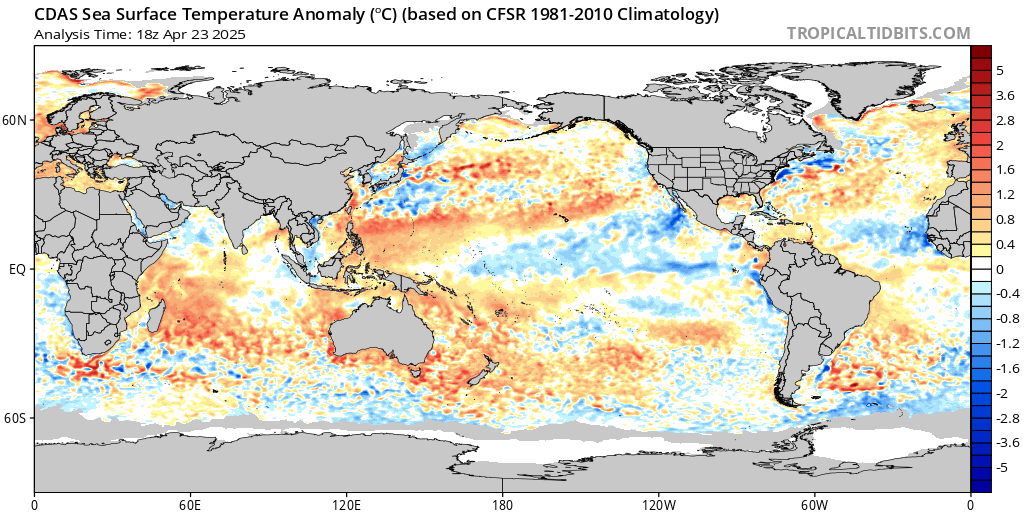
Sea surface temperature is impacted by storms. East of Australia west of NZ has a cyclone running through it. I'm in it, a lot of wind rain not here but elsewhere stirring the surface down to a depth of many meters, which will appear as cooling. This is visible on the map above from Duwayne.
A period of low storm activity and the Western Pacific is the epicenter of tropical cyclones on earth could look like warming however the mixing actually reduces re-radiation long-term.
|
|
|
|
Post by missouriboy on Feb 13, 2022 3:00:43 GMT
Missouri, you note the difference between the La Nina pattern this year and the prior La Nina which followed the previous Solar minimum. There has been a notable difference between these two La Ninas throughout their existence and even in the months prior. The difference in the pattern in the months prior is why I questioned whether the current La Nina would actually happen. If the Solar minimum was the major driver, shouldn't the patterns look similar prior to the La Ninas? Shouldn't the La Ninas be quite similar?
As it turned out your La Nina prediction was correct with respect to the sea surface temperatures in the ENSO3.4 area which define a La Nina so there is some added evidence for the Solar Minimum driving force.
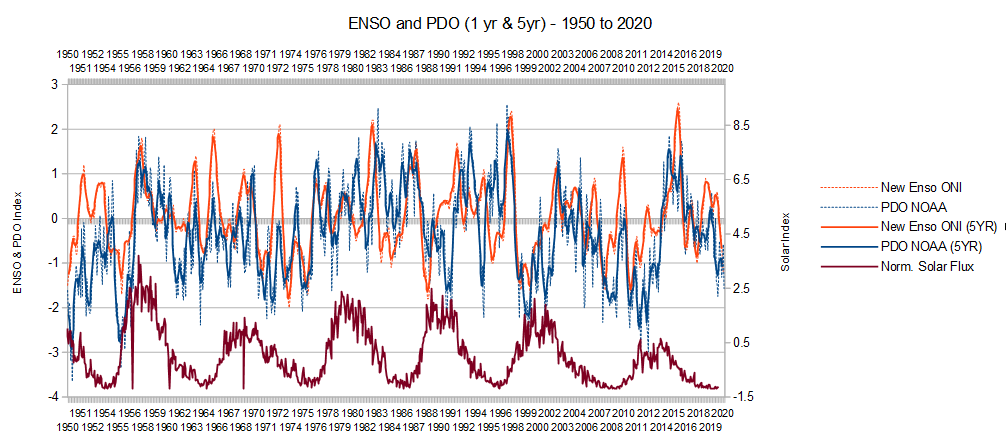
While we have a minimal number of observations, it has occurred to me that there might be some relationship with inter-hemisphere circulatory characteristics and the 22-year Hale cycle. As I noted, cold SSTAs for the pre-cycle La Nina of 1998 are coming predominately from the the NE Pacific, while those during the pre-cycle La Nina of 2020 are coming predominately from the SE Pacific. Go back 22 years from 1998 and you arrive at "the Great Climate Shift" ... More flow moving from the SE Pacific? If you look at the pre-cycle La Ninas in between (Schwabe Cycles) (1987 and 2009) and you will note that the cold flows are semi-equally split NE and SE. You can see these ups and downs in the ENSO-PDO timeseries chart below also. I note that the pre-cycle La Nina occurs in the same location just after the cycle starts, but in the case of SC25, the preceding El Nino was lower and longer.
 |
|
|
|
Post by missouriboy on Feb 13, 2022 3:28:41 GMT
The Current subsurface warm water plume. Note that the deeper warm water plumes are now coming from further east, where previously they were further west.  |
|
|
|
Post by missouriboy on Feb 14, 2022 2:26:28 GMT
UAH Lower Troposphere Temperature Anomalies (Global & Tropics) With ENSO-ONI and Normalized Sunspots (Monthly 1995-Jan. 2022)  |
|
|
|
Post by missouriboy on Feb 17, 2022 1:23:26 GMT
What is that cold water patch emerging south and east of Japan? Not wanting to go out on a limb here ... but seems I started seeing that coming on as we noticed that Kelvin wave emerging.  |
|
|
|
Post by acidohm on Mar 7, 2022 18:45:17 GMT
Well, that's a bit of an odd thing. I kinda assumed enso would head to neutral? If its still -ve later in year that's fairly protracted!  And leans towards Astros forecast.... |
|
|
|
Post by missouriboy on Mar 7, 2022 19:03:13 GMT
If that were to occur, it would be longer than any double Nina I show on record. A fast glance shows the combined double-Nina for SC20 lasted about 20 months. This forecast would beat that?
|
|
|
|
Post by acidohm on Mar 7, 2022 20:11:10 GMT
If that were to occur, it would be longer than any double Nina I show on record. A fast glance shows the combined double-Nina for SC20 lasted about 20 months. This forecast would beat that? Good info Mr Missouri. My interest in enso had waned somewhat.. but this is interesting! |
|
|
|
Post by duwayne on Mar 7, 2022 22:21:06 GMT
So far, the 2020-21 ENSO3.4 has not been as cold as the 1998-99 and the 2010-11 La Ninas. Notice that the 1998-99 La Nina did remain cool for close to another year.
As one who believes we are in the 30-year cool phase of the 60-year ocean current cycle I had anticipated that ENSO over the 2007-2037 period would be on the cool side and would have an average reading similar to the 1947-1977 period of 60 years prior. So far the averages are very similar as I report every few months. An extension of the current cool ENSO would be consistent with the cool phase concept.
|
|
|
|
Post by nonentropic on Mar 7, 2022 23:19:53 GMT
Yes on the Australian BOM sort of went soft then wam back positive again. Thats the SOI. www.longpaddock.qld.gov.au/soi/So MB does this mean an extended period of cooling? Low solar sort of favours La Nina?? |
|