|
|
Post by missouriboy on Oct 4, 2023 17:22:26 GMT
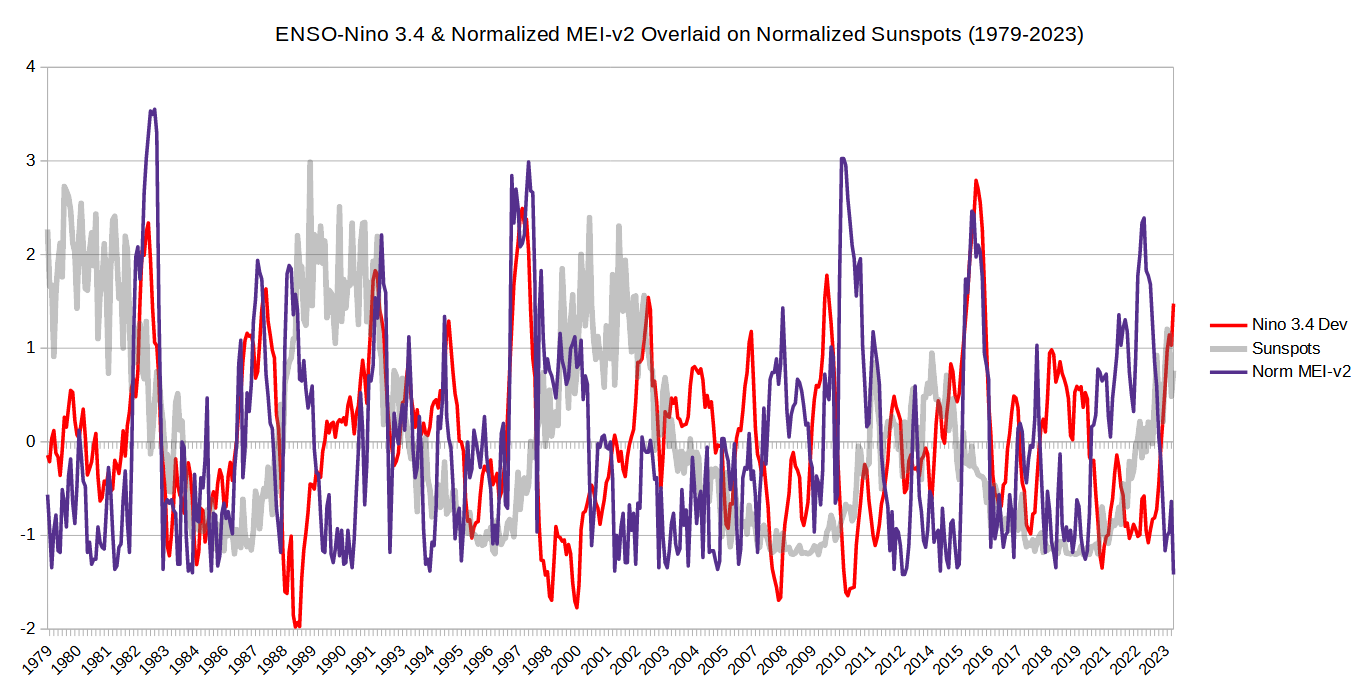
Duwayne noted that there appear to be some significant differences between the Multi-variant ENSO Index (MEI-v2) and the NOAA ENSO Index. There are ... and these are large enough I think, to warrant a thread of their own. I hope that Duwayne and others can provide some detail on the data used in compiling the MEI index. In general, I understand that NOAA uses sea surface temperatures exclusively, while the Multi-Variant ENSO Index (MEI) uses other variables as well. Below is a chart comparing these two indexes over laid on the sunspot times series index.
The two indexes produce similarly positive values during El Nino events that occur at the start of solar cycles SC22-24 and those that occur just-past-peak of SC22-24. Elsewhere, the similarity seems to fall apart. Note the very large differences during La Ninas following the pre-cycle Ninos. Note that there is something very strange happening in SC25 seemingly inconsistent with past cycles.
So why does the MEI Index behave so differently at different points of the solar cycle? Why is the MEI positive during La Nina periods when the NOAA index is negative? Why is the MEI now so low in comparison to NOAA's ENSO index at this point on the solar cycle?
 |
|
|
|
Post by code on Oct 10, 2023 14:29:49 GMT
As a skier I was interested to know if I will ski. 2015 was a terrible year and both ENSO's were high, this year they are split?
|
|
|
|
Post by missouriboy on Oct 10, 2023 15:53:38 GMT
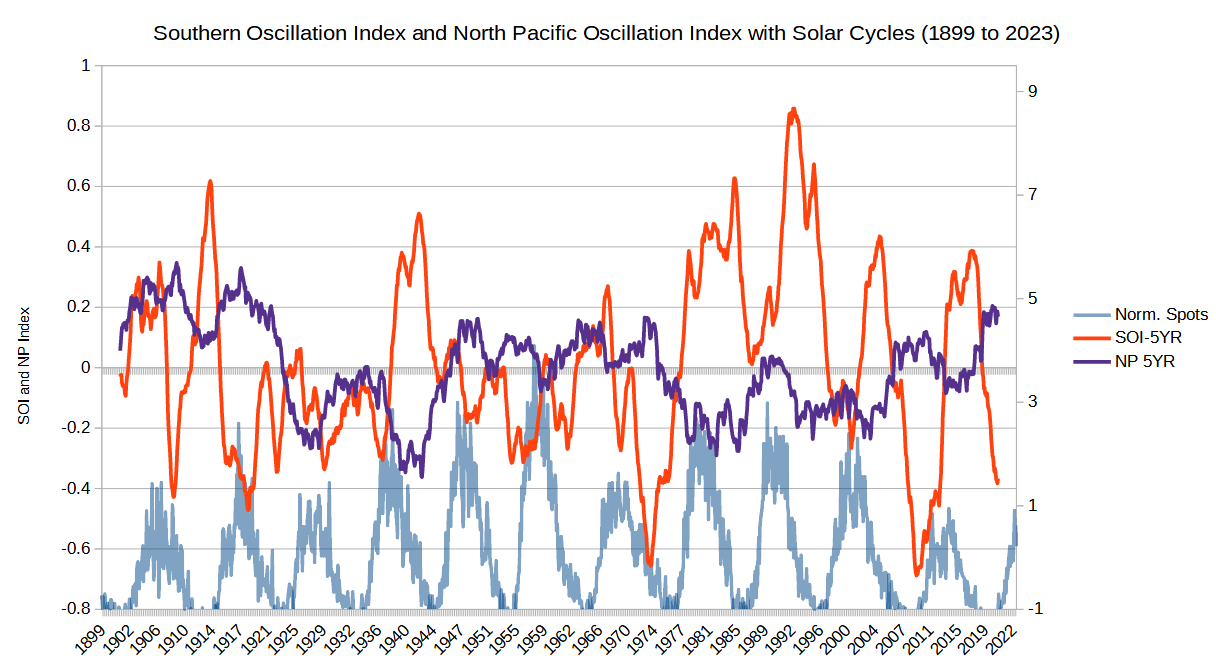
Where are the last 7 to 8 years of that chart? Does the North Pacific Oscillation look somewhat similar?
 |
|