|
|
Post by code on Mar 29, 2023 13:28:52 GMT
Well there goes the snow in the PNW! |
|
|
|
Post by missouriboy on Mar 29, 2023 21:19:53 GMT
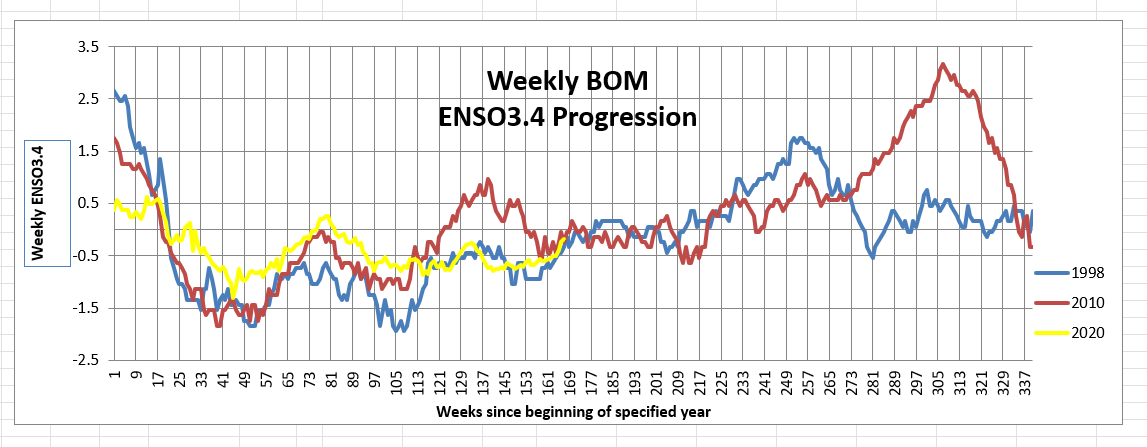
Well there goes the snow in the PNW! Will this PNW snowpack completely melt by August? If the 4th year of SC25 has a Nino progression similar to SC23 and SC24, we won't have a mid-Pacific El Nino (SSTA +0.5 or more) till week 225 (spring 2024).
Borrowing duwayne's chart again.  |
|
|
|
Post by missouriboy on Apr 5, 2023 23:47:29 GMT
Some interesting warm streams in the Pacific. And that big red one along Peru-Equador appears to not all be coming from that gravity wave. Some geothermal? Only a small slice getting measured in that vertical cross section. |
|
|
|
Post by duwayne on Apr 6, 2023 15:38:37 GMT
Some interesting warm streams in the Pacific. And that big red one along Peru-Equador appears to not all be coming from that gravity wave. Some geothermal? Only a small slice getting measured in that vertical cross section. As the westerly winds slow the water which had been stacked up towards the west will back up and "cover up" the upwelling. In addition the upwelling itself could be reduced because of the below average west winds although the SOI is close to average. But the SOI isn't specific to the area off the Peru coast, so the winds could have slowed more there. I'd be surprised if the warming was due to thermals. |
|
|
|
Post by missouriboy on Apr 6, 2023 16:32:56 GMT
Some interesting warm streams in the Pacific. And that big red one along Peru-Equador appears to not all be coming from that gravity wave. Some geothermal? Only a small slice getting measured in that vertical cross section. As the westerly winds slow the water which had been stacked up towards the west will back up and "cover up" the upwelling. In addition the upwelling itself could be reduced because of the below average west winds although the SOI is close to average. But the SOI isn't specific to the area off the Peru coast, so the winds could have slowed more there. I'd be surprised if the warming was due to thermals. Since the measurements are only for a slice, it's hard to tell where it's coming from (N, S, W?). However, it's from deeper than the slice of the gravity wave in the upper 300 meters. So seems that something is happening further down. Time for ARGO but I don't have it. I would be very surprised if there was no heat coming from that fractured rise. The only question is how much. There was a paper posted here on that topic some time back, but I don't remember any total heat quantification.
|
|
|
|
Post by blustnmtn on Apr 6, 2023 17:55:48 GMT
As the westerly winds slow the water which had been stacked up towards the west will back up and "cover up" the upwelling. In addition the upwelling itself could be reduced because of the below average west winds although the SOI is close to average. But the SOI isn't specific to the area off the Peru coast, so the winds could have slowed more there. I'd be surprised if the warming was due to thermals. Since the measurements are only for a slice, it's hard to tell where it's coming from (N, S, W?). However, it's from deeper than the slice of the gravity wave in the upper 300 meters. So seems that something is happening further down. Time for ARGO but I don't have it. I would be very surprised if there was no heat coming from that fractured rise. The only question is how much. There was a paper posted here on that topic some time back, but I don't remember any total heat quantification.
is this it? solarcycle25com.proboards.com/post/6686/thread |
|
|
|
Post by missouriboy on Apr 6, 2023 19:06:52 GMT
Since the measurements are only for a slice, it's hard to tell where it's coming from (N, S, W?). However, it's from deeper than the slice of the gravity wave in the upper 300 meters. So seems that something is happening further down. Time for ARGO but I don't have it. I would be very surprised if there was no heat coming from that fractured rise. The only question is how much. There was a paper posted here on that topic some time back, but I don't remember any total heat quantification.
is this it? solarcycle25com.proboards.com/post/6686/threadThanks Blu. That is another one that I had forgotten about. I found the other one and it is the solarcycle25 thread posted above. I think that weak sun and La Nina weighted ENSOs translate to cooler global temps. "They" won't want to see it ... but it will become obvious. And geothermal will likely have some input ... but we're left with no real idea of that magnitude. |
|
|
|
Post by code on Apr 6, 2023 22:44:40 GMT
We are a long way from 2016 but the year is new.
|
|
|
|
Post by duwayne on Apr 7, 2023 14:35:45 GMT
If you focus on the equator at 180, you can see the warm anomaly work its way toward the east. As I said above I think this is because the westerly winds died down and the warm water stacked in the west is sloshing to the east. As a minimum I would think the normal rate of cool water which flows from the east has been reduced. (This chart updates daily so it could look different in a few days. Now it shows an expanding warm area which appears to be moving from west to east along the equator from 180 degrees.)
Missouri, can you be more specific about the geothermal flows you expect are happening?
|
|
|
|
Post by flearider on Apr 7, 2023 17:14:15 GMT
If you focus on the equator at 180, you can see the warm anomaly work its way toward the east. As I said above I think this is because the westerly winds died down and the warm water stacked in the west is sloshing to the east. As a minimum I would think the normal rate of cool water which flows from the east has been reduced. (This chart updates daily so it could look different in a few days. Now it shows an expanding warm area which appears to be moving from west to east along the equator from 180 degrees.)
Missouri, can you be more specific about the geothermal flows you expect are happening?
but wont the upwelling from the south kill off the heat as it's not much ? |
|
|
|
Post by missouriboy on Apr 7, 2023 17:39:56 GMT
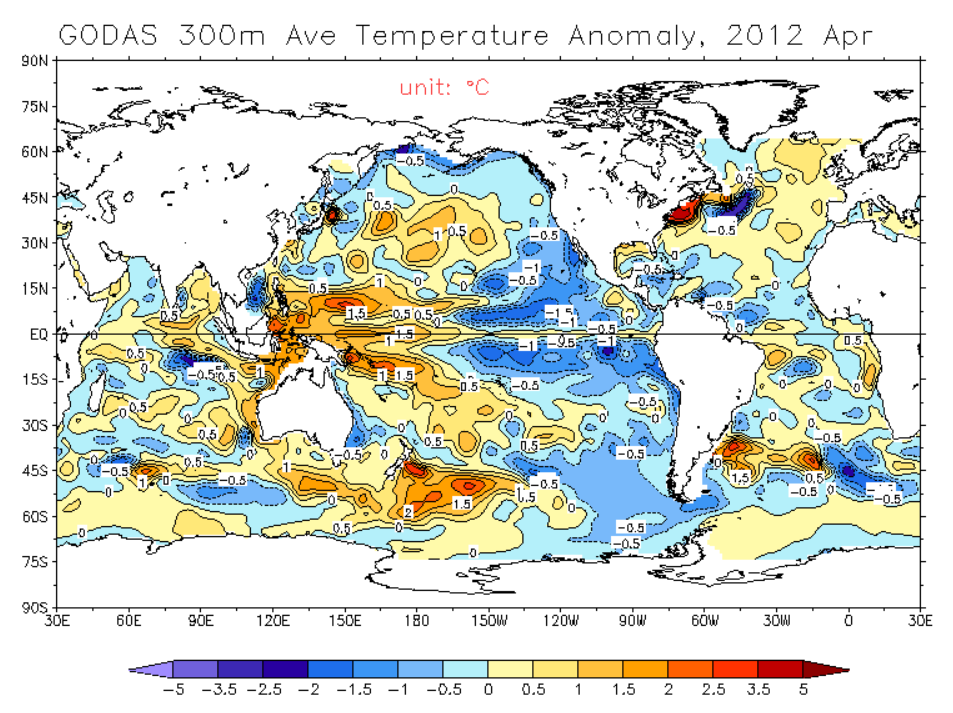
Everything I've seen suggests that oceanic crustal "hotspots" do release heat. Two in question ... the very large and active hotspot area around Indonesia in the Western Warm Pool ... and the East Pacific Rise in the S. Pacific off the coast of Equador-Peru. The unanswered question is ... is there enough heat released periodically or systematically to make a difference to ENSO effects. I do not have and have not read an answer to that. Looking at the Pacific SSTA setups going into 2023. Same month into SC24 and SC25 - December 2011 and December 2022. The Pacific Warm Pool - Indian Ocean heat distributions are different. The switch to Negative IOD leaves the West Indian cool and more heat concentrated north of Australia. A setup last seen to this extent back around 1950s. Western Warm Pool SST heat "may" have been slightly more extensive in 2011 ... but it's hard to visually quantify. Interesting that the same warm plume is located in NE American coast.
For comparison to your April 2023 image ...   It is interesting that that positively hot CDAS SSTA blob along the Peruvian coast on April 5 doesn't show up on the GODAS April 3 map.  |
|
|
|
Post by duwayne on Apr 8, 2023 1:44:36 GMT
|
|
|
|
Post by missouriboy on Apr 9, 2023 0:03:46 GMT
In 2014 they were just a little early as the 2015 El Nino took off shortly thereafter. In 2017, they were squashed by the large La Nina following the 2015 El Nino. That one they should have seen coming. This one we will see. |
|
|
|
Post by ratty on Apr 9, 2023 4:45:57 GMT
|
|
|
|
Post by nonentropic on Apr 9, 2023 19:48:19 GMT
I was about to post that also is it a depression in the Darwin area?
|
|