|
|
Post by missouriboy on Jul 4, 2021 3:31:51 GMT
Any cyclic stuff you can see needs to be backed out of the background temperature changes. Ultimately we know the temperature on earth has risen since the LIA what is not understood it seems is what is the driver. All discussions relating to CO2 are compromised by this undefined variable. The solar driver seems a good place to start. So we have a modestly changing watts/M2 cyclical change small maybe even not material also linked to solar cycles. The elephant in the room is frequency content in that cyclic process. This looks to be a possible candidate for the changes we see. We know that clouds and water temperature are impacted by the changes in this frequency content. So what MB is doing in my mind is build a story about the cycles and then working out if they can be backed out of the data to allow a clear relationship of frequency and temperature to be visible or something else. Only then will we know the CO2 ECS. We know the mechanism by which oceanic heat is transferred to the atmosphere. Evaporation. And while evaporation occurs across various areas of the oceans, it seems heavily concentrated in the central-eastern equatorial Pacific. ENSO is one of the most extensively studied natural processes on the planet. And justifiably so, as it seems inexorably tied to lower troposphere temperatures. When ENSO burps in its El Nino phase, the troposphere gets gas. Water vapor to be exact, and the massive quantities of heat tied up in its bonds. Enough that UAH tropical and global temperatures obviously respond with a temporal lag. According to Dr Roy Spencer, it is the “natural microwave thermal emissions from oxygen in the atmosphere” that is being measured. “The intensity of the signals these microwave radiometers measure at different microwave frequencies is directly proportional to the temperature of different, deep layers of the atmosphere." Apparently, these are positively affected by these heat pulses from the ocean and negatively affected by the coolings of La Nina. This graphical ENSO-UAH comparison is not a random relationship. Joe Bastardi has long noted this atmospheric temperature response. He has also noted that we do not know water vapor's residence time in the atmosphere. But when La Nina's cold water replaces La Nina's warm, UAH tropospheric temperature anomalies drop, also with a lag. But over the 42 years for which we have satellite data, we seemingly see a positive step progression in UAH anomalies, fed by eastward pulses of warm waters about every 6 years (two per solar cycle). Atmospheric anomalies climb following each warm eastward pulse, and decline with each westward cold water return. I note that our time series starts at the beginning of the second half of the 20th century solar maximum. So, should what goes up, logically also come down if less energetic solar cycles provide less heating to the tropical Pacific Ocean … which is the fuel for the atmospheric heating. And here we are, 6 years past the last big Nino, and at the beginnings of what may be a second low solar cycle. We have seen the lowest pre-cycle El Nino since the beginning of Solar Cycle 21. We see large quantities of atmospheric moisture beeing shed along the edges of a more longitudinal jet stream pattern. We don't know if this results in less atmospheric water vapor, but a cooling equatorial Pacific may send less vapor aloft. The following chart seems to show a declining ENSO effect over time.  |
|
|
|
Post by duwayne on Jul 4, 2021 19:31:11 GMT
Missouri, from your post above…
“UAH lower troposphere temperature anomalies over the global and tropical oceans show a solar-driven stepped increase of about 0.5C since 1978.”
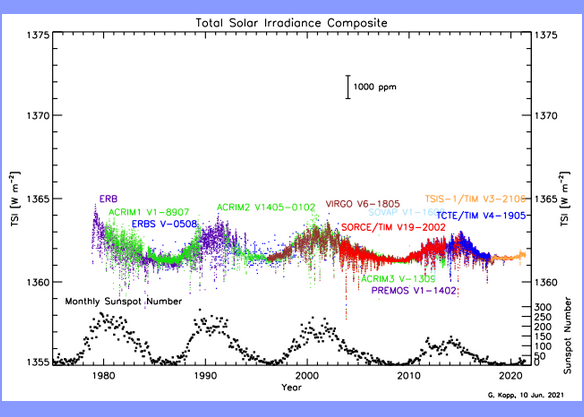
The chart below shows the solar energy delivered to the earth since 1978. It has been declining slightly. The TSI is the total solar energy in watts per square meter including all wavelengths.
This chart is from the website below.
spot.colorado.edu/~koppg/TSI/Svaalgard’s website shows the same information. The TSI changes are “magnified” in the charts since they only show the tip of readings. The scale starts at 1355. The actual drop as measured by a trendline is something like 0.1% from 1978 to 2021. This wouldn't affect temperatures by more than about -0.1C.
Something has to happen within the earth's atmosphere to cause temperatures to change significantly because direct TSI is pretty stable over decadal periods. There are shorter-term cyclical changes due to the solar cycle. Changes could be due to cloud changes, wind flows, ocean current flows, greenhouse gas growth, etc.
|
|
|
|
Post by Sigurdur on Jul 4, 2021 19:42:30 GMT
Missouri, from your post above…
“UAH lower troposphere temperature anomalies over the global and tropical oceans show a solar-driven stepped increase of about 0.5C since 1978.”
The chart below shows the solar energy delivered to the earth since 1978. It has been declining slightly. The TSI is the total solar energy in watts per square meter including all wavelengths.
This chart is from the website below.
spot.colorado.edu/~koppg/TSI/Svaalgard’s website shows the same information. The TSI changes are “magnified” in the charts since they only show the tip of readings. The scale starts at 1355. The actual drop as measured by a trendline is something like 0.1% from 1978 to 2021. This wouldn't affect temperatures by more than about -0.1C.
Something has to happen within the earth's atmosphere to cause temperatures to change significantly because direct TSI is pretty stable over decadal periods. There are shorter-term cyclical changes due to the solar cycle. Changes could be due to cloud changes, wind flows, ocean current flows, greenhouse gas growth, etc.
There is a significant change in band concentration from the sun. Increased or decreased UV is more important than climate models give it credit for. |
|
|
|
Post by missouriboy on Jul 4, 2021 20:53:41 GMT
Missouri, from your post above…
“UAH lower troposphere temperature anomalies over the global and tropical oceans show a solar-driven stepped increase of about 0.5C since 1978.”
The chart below shows the solar energy delivered to the earth since 1978. It has been declining slightly. The TSI is the total solar energy in watts per square meter including all wavelengths.
This chart is from the website below.
spot.colorado.edu/~koppg/TSI/Svaalgard’s website shows the same information. The TSI changes are “magnified” in the charts since they only show the tip of readings. The scale starts at 1355. The actual drop as measured by a trendline is something like 0.1% from 1978 to 2021. This wouldn't affect temperatures by more than about -0.1C. Something has to happen within the earth's atmosphere to cause temperatures to change significantly because direct TSI is pretty stable over decadal periods. There are shorter-term cyclical changes due to the solar cycle. Changes could be due to cloud changes, wind flows, ocean current flows, greenhouse gas growth, etc.
There is a significant change in band concentration from the sun. Increased or decreased UV is more important than climate models give it credit for. It is unfortunate that I cannot immediately find a full, interpreted SORCE data set. A short search yielded this document on comparisons between SC23 and SC24 in the shorter wavelengths. agupubs.onlinelibrary.wiley.com/doi/full/10.1002/2015JA022231 |
|
|
|
Post by missouriboy on Jul 4, 2021 21:33:51 GMT
Atmospheric windows for solar UV radiation   |
|
|
|
Post by missouriboy on Jul 4, 2021 21:54:39 GMT
|
|
|
|
Post by Sigurdur on Jul 4, 2021 22:48:49 GMT
There is a significant change in band concentration from the sun. Increased or decreased UV is more important than climate models give it credit for. It is unfortunate that I cannot immediately find a full, interpreted SORCE data set. A short search yielded this document on comparisons between SC23 and SC24 in the shorter wavelengths. agupubs.onlinelibrary.wiley.com/doi/full/10.1002/2015JA022231 I thought I had found a source and posed it on the old board? |
|
|
|
Post by code on Jul 5, 2021 3:43:59 GMT
My favorite paragraph in the article:
A periodic solar event called a "grand minimum" could overtake the sun perhaps as soon as 2020 and lasting through 2070, resulting in diminished magnetism, infrequent sunspot production and less ultraviolet (UV) radiation reaching Earth — all bringing a cooler period to the planet that may span 50 years.
|
|
|
|
Post by missouriboy on Jul 5, 2021 4:32:44 GMT
My favorite paragraph in the article:
A periodic solar event called a "grand minimum" could overtake the sun perhaps as soon as 2020 and lasting through 2070, resulting in diminished magnetism, infrequent sunspot production and less ultraviolet (UV) radiation reaching Earth — all bringing a cooler period to the planet that may span 50 years.
Hopefully you will be able to build entire snow palaces in the Cascades. Should keep the Willamette and parts north wet for a while. Assuming that your circulation patterns are not largely from the south. |
|
|
|
Post by missouriboy on Jul 5, 2021 5:05:31 GMT
Question of the day. What were the mechanics of ocean cooling in previous time periods like the Maunder? We are assuming that they did. Current ENSO monthly timeseries for regions 1+2 and 3 through June 2021. They appear to be at or near their seasonal summer peak. 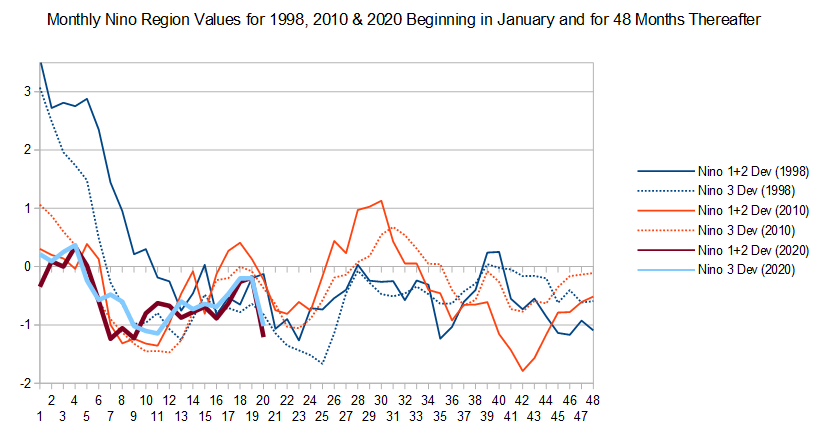 |
|
|
|
Post by Sigurdur on Jul 5, 2021 12:14:24 GMT
Question of the day. What were the mechanics of ocean cooling in previous time periods like the Maunder? We are assuming that they did. Current ENSO monthly timeseries for regions 1+2 and 3 through June 2021. They appear to be at or near their seasonal summer peak.  We really have no idea. |
|
|
|
Post by duwayne on Jul 5, 2021 14:20:19 GMT
There is a significant change in band concentration from the sun. Increased or decreased UV is more important than climate models give it credit for. It is unfortunate that I cannot immediately find a full, interpreted SORCE data set. A short search yielded this document on comparisons between SC23 and SC24 in the shorter wavelengths. agupubs.onlinelibrary.wiley.com/doi/full/10.1002/2015JA022231 What should I conclude from this article? |
|
|
|
Post by duwayne on Jul 5, 2021 14:54:17 GMT
Missouri, I'm still looking for your rationale and supporting data which allow you to conclude the 0.5C increase in global temperatures since 1978 was cased by the sun. It may be somewhere in the charts you posted but it wasn't clear to me. I could guess what you might be thinking, but I'd rather you say it.
|
|
|
|
Post by missouriboy on Jul 6, 2021 0:06:47 GMT
Missouri, I'm still looking for your rationale and supporting data which allow you to conclude the 0.5C increase in global temperatures since 1978 was cased by the sun. It may be somewhere in the charts you posted but it wasn't clear to me. I could guess what you might be thinking, but I'd rather you say it. The thesis, step by step ... with supporting data. The tropical and sub-tropical oceans are largely heated by the sun. Largely visible and UV solar inputs in the central-eastern Pacific. SSTA anomalies for the tropical Pacific between 130E & 80W show the trends and macro ENSO events between 1979 and 2021. Major change in frequency between solar cycles 21–22 and 23-24 ( Chart 1). The Troposphere is largely heated by the oceans via evaporation in the central-eastern Pacific. UAH Lower Troposphere temperature anomalies (global & tropics) show a distinct, lagged relationship to ENSO events ( Chart 2). There is a net global troposphere increase of about 0.5 to 0.6 C between 1979 and 2021. This occurs in three distinct steps following major El Ninos. Twenty-five month centered running averages of both heat measures reproduce the related step increases in both the SSTA and the UAH measures ( Chart 3). This does not preclude other factors. 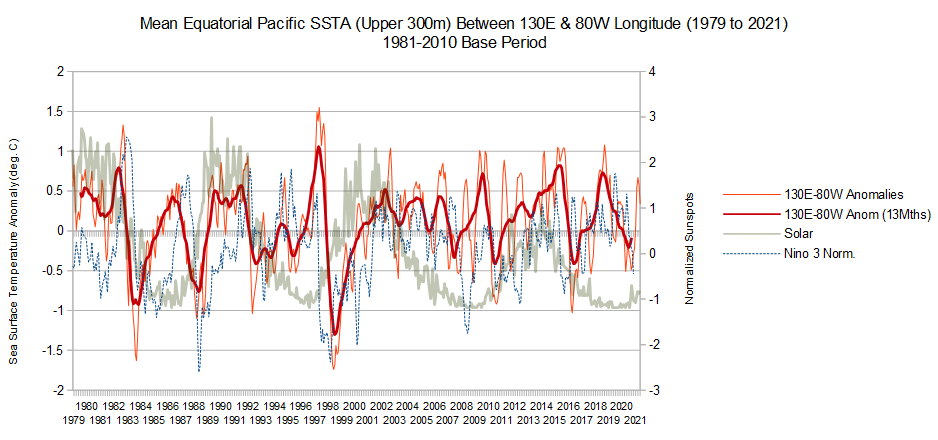 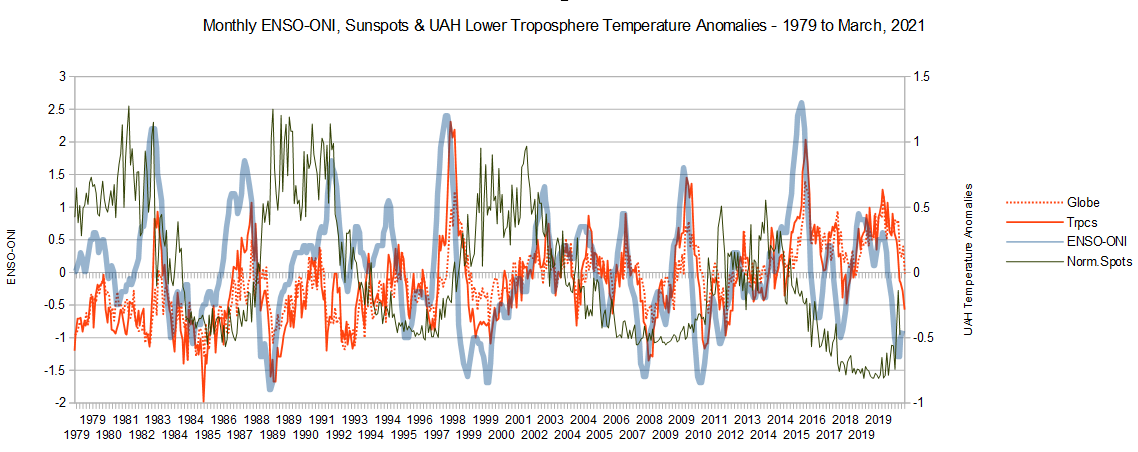 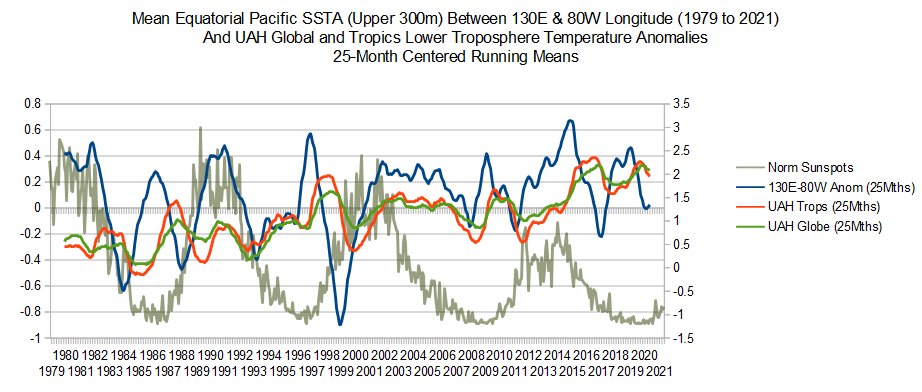 |
|
|
|
Post by duwayne on Jul 6, 2021 23:39:10 GMT
Missouri, I'm still looking for your rationale and supporting data which allow you to conclude the 0.5C increase in global temperatures since 1978 was cased by the sun. It may be somewhere in the charts you posted but it wasn't clear to me. I could guess what you might be thinking, but I'd rather you say it. The thesis, step by step ... with supporting data. The tropical and sub-tropical oceans are largely heated by the sun. Largely visible and UV solar inputs in the central-eastern Pacific. SSTA anomalies for the tropical Pacific between 130E & 80W show the trends and macro ENSO events between 1979 and 2021. Major change in frequency between solar cycles 21–22 and 23-24 ( Chart 1). The Troposphere is largely heated by the oceans via evaporation in the central-eastern Pacific. UAH Lower Troposphere temperature anomalies (global & tropics) show a distinct, lagged relationship to ENSO events ( Chart 2). There is a net global troposphere increase of about 0.5 to 0.6 C between 1979 and 2021. This occurs in three distinct steps following major El Ninos. Twenty-five month centered running averages of both heat measures reproduce the related step increases in both the SSTA and the UAH measures ( Chart 3). This does not preclude other factors.    Missouri, you say….. “UAH Lower Troposphere temperature anomalies (global & tropics) show a distinct, lagged relationship to ENSO events (Chart 2). There is a net global troposphere increase of about 0.5 to 0.6 C between 1979 and 2021. This occurs in three distinct steps following major El Ninos.”
You didn’t actually say it, but I believe you are concluding that the temperature increase is due to the El Ninos since they were driving the “steps”.
Here’s my assessment. Let’s say there was a church that needed money for a project and 2 members volunteered to help. The first day they each brought a dollar and put it in the collection basket. The pastor checks the basket and notes there are 2 dollars.
The second day, one of the donors puts another dollar in the basket. The second donor comes to the church and takes a dollar out. The pastor checks the basket and notes there are still 2 dollars.
The next day the donor who took his dollar back now puts it back in the basket. The other donor puts another dollar in. There are now 4 dollars in the basket which the pastor is happy to see.
The fourth day the stingy donor takes his dollar back. The other adds a dollar. After 4 days there are 4 dollars in the basket all from one donor.
The net result is that one donor donates nothing even though he can be observed putting money in the basket. The other donor is the one who supplies the money.
If only ENSO is involved, there will be El Ninos and La Ninas but their net effect on global temperatures in the long run will be near zero. ENSO giveth and ENSO taketh away. There are La Ninas with their negative temperature anomalies in addition to El Ninos It’s hard to expect a lot when ENSO is just the result of wind changing directions. It is not a product of outside heat coming in from the sun to add to the earth's heat cache.
If the global temperature is steadily increasing over a lengthy period of time I believe one should look beyond ENSO even though the step-ups in temperature coincide with El Ninos. |
|


