dej
New Member

Posts: 30
|
Post by dej on Aug 29, 2021 18:03:12 GMT
I expect 1.5c for winter 2021-2022. Just hope goes no lower for following winters.
|
|
|
|
Post by missouriboy on Aug 29, 2021 22:14:27 GMT
Note the stepdown frequencies, their trends and their ranges in the 2015-2021 period that started with the last great oceanic heat discharge. Note the two step Nina (2016-17 and 2017-18), with second step being greater than the first. Note that the first step of the current Nina (2020-21) was as deep as 2017-18. If the relationship continues, could be one hell of a second half.   |
|
|
|
Post by missouriboy on Sept 4, 2021 4:44:15 GMT
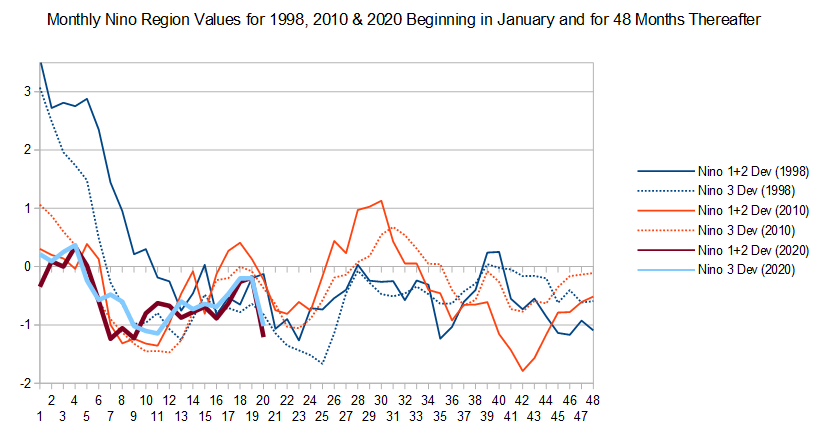
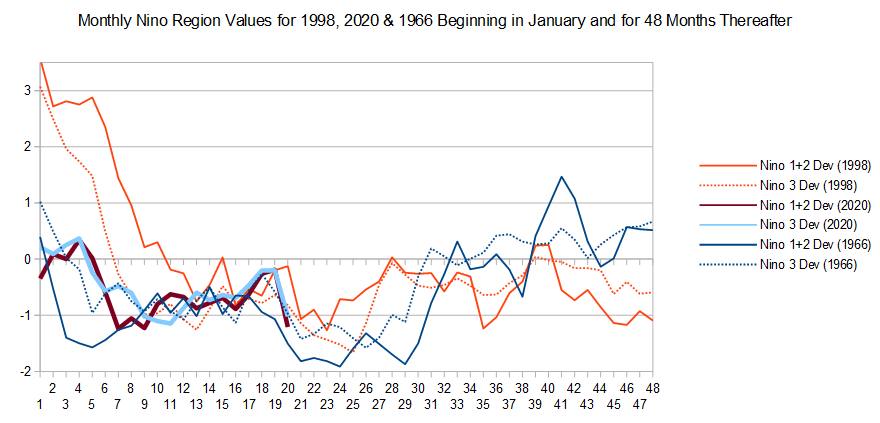
Monthly Nino Region SSTAs are in for August. Big drop. She's going down. The two charts below compare this Nina for regions 1+2 and 3 for the extended La Ninas starting in 1998, 2010 and 2020. The second chart substitutes 1966 for 2010 as it was the deepest pre-cycle Nina on record since 1950. The winters of 1966 and 1967 were bitter in N America. www.weather.gov/fgf/blizzardof66 en.wikipedia.org/wiki/1967_Chicago_blizzard In the UK, the famous winter was 1962-63. We can share Acid.    |
|
|
|
Post by Sigurdur on Sept 6, 2021 3:55:12 GMT
|
|
|
|
Post by missouriboy on Sept 6, 2021 8:03:52 GMT
And the heat (or lack) of that which is to be moved, is ... dare we say it ... due largely to the sun? Heated as it's pushed westward and accumulated until released eastward by a gravitational pulse? Where during Nino surfacing waves return heat to the troposphere via great evaporation pools, which are then moved globally on their journey back to space. And what are those heat concentrations at 2000 meters?  |
|
|
|
Post by acidohm on Sept 15, 2021 4:53:17 GMT
|
|
|
|
Post by missouriboy on Sept 15, 2021 19:19:02 GMT
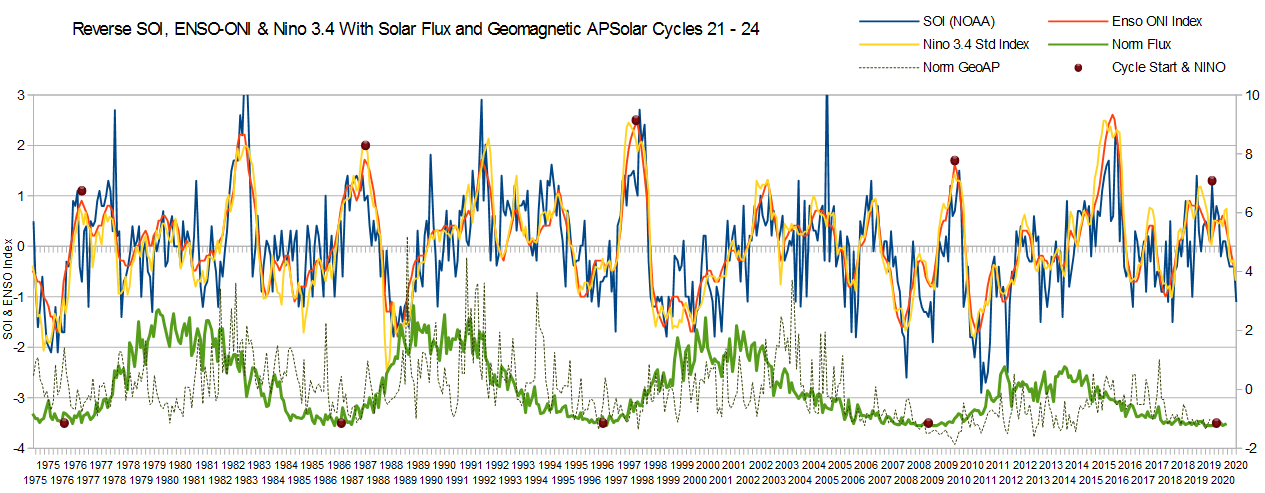
So the median forecast is -1.5 by the end of the year. The outliers hit -2.0 and -2.5. That would be "recent" record territory ... which would gel nicely with a record winter. Refer up the page to charts. Nino Region 3.4 hit -2.0 in 1975 and 1988 hit -2.5. The short downturn in 2020 almost hit -2.0 on the weekly index, but nowhere close on the monthly index.
Not Like!!!
|
|
|
|
Post by missouriboy on Sept 25, 2021 2:47:34 GMT
Four more weekly ENSO region measurements in (taken from Tropical Tidbits). All four Regions are heading down again after the summer upturn and the UAH monthly temperatures are now turning down also. Seven months to go. Tally-ho!  |
|
|
|
Post by acidohm on Sept 29, 2021 17:18:12 GMT
Subsurface currently cooling to cold  As cold as last years La Nina  But compare ssta to 2010/11 La Nina and time of year...  Whatever is currently happening at surface atm it's weaker and later. |
|
|
|
Post by blustnmtn on Sept 29, 2021 19:35:49 GMT
Subsurface currently cooling to cold  As cold as last years La Nina  But compare ssta to 2010/11 La Nina and time of year...  Whatever is currently happening at surface atm it's weaker and later. Astro is not surprised. |
|
|
|
Post by missouriboy on Sept 29, 2021 19:53:03 GMT
As the table and chart show, the second wave of the pre-cycle 24 Nina was weaker than the first (2010, 2011). The current 180-100W cross-section shows current second wave at the same level as the first (although not yet expressed on the 3-month averages of the table). The weekly chart below shows all four regions heading down, but not yet at first wave levels. Of course, these are surface deviations, and the cross-section current cold at depth has not yet surfaced. Look out above! Winter's coming (cheap Game of Thrones ripoff  ). So far region 4 was colder in 2010-11, while this Nina has so-far been concentrated further east. That may change and the depth of this second downturn may surprise. AND ... as goes the tropical ocean, so goes the troposphere. THEY can keep throwing all the CO2 they want to at the perceived warming problem and it won't make one Sloopy Joe's worth of difference. Tally-ho!  |
|
|
|
Post by ratty on Sept 29, 2021 23:40:14 GMT
Subsurface currently cooling to cold  As cold as last years La Nina  But compare ssta to 2010/11 La Nina and time of year...  Whatever is currently happening at surface atm it's weaker and later. Astro is not surprised. are not amused. |
|
|
|
Post by acidohm on Oct 4, 2021 17:33:11 GMT
Weekly change shows increase in ENSO region temps.  Subsurface cold is building however.  Overall ENSO smoothed value nudges down 1°c  Seems a bit of a lacklustre Nina at the moment to be honest. Astro has stated that this NINA will extend through 2022, is it just gathering itself? |
|
|
|
Post by missouriboy on Oct 4, 2021 22:00:25 GMT
We will have better idea by the end of November. Region 3 needs to fall another 1C in two months ... or 3 if you're using the ONI 3-mth centered value. And that looks like a big plug of cold water.
Does anyone have a similar pentad analysis image for September 30, 2011?
|
|
|
|
Post by missouriboy on Oct 5, 2021 12:05:11 GMT
Weekly change shows increase in ENSO region temps.  Subsurface cold is building however. . .. and to me, represents the remaining remnant of the mid-Nina summer warm leftover, busily evaporating surface H2O and its heat to the overlying atmosphere ... AND being slowly replaced by cold water at depth, which is and will surface as that bubble of heat dissapates. Glory in its short remaining global effects. Watch a similar map turn very blue a month or two down the road, and it's cold will feed the atmosphere a much cooler, dryer diet. That blue in the north (Atlantic & Pacific) may expand southward. |
|