|
|
Post by duwayne on Sept 10, 2022 16:59:52 GMT
The Final IPCC Sixth Assessment Report (AR6) will be issued sometime in the next several months. The Summary for Policymakers on the Physical Science Basis of Climate Change portion of the study has been out for some time with minimal fanfare.
There are 2 more working group reports.
1)Impacts, Adaptation, and Vulnerability 2)Mitigation of Climate Change
The Final Overall Summary Report is scheduled for later on.
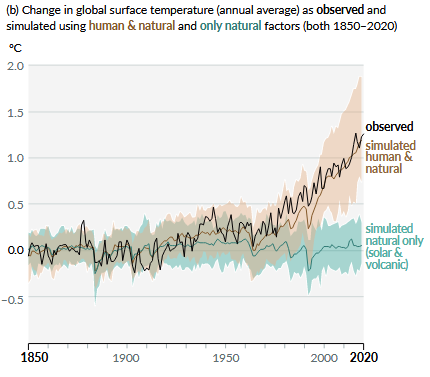
This is the key chart from the Physical Science summary.

I’ll give you some time to look out the chart and draw conclusions. I’ll give my thoughts in a couple of days.
This is the link to the Physical Science summary report… www.ipcc.ch/report/ar6/wg1/downloads/report/IPCC_AR6_WGI_SPM.pdf |
|
|
|
Post by Sigurdur on Sept 10, 2022 18:40:45 GMT
1. For some reason the early 20th century warming has become a lot less. Observation
2. CO2 increase had no noticeable effect until approximately 1970??
|
|
|
|
Post by missouriboy on Sept 10, 2022 21:44:15 GMT
I don't immediately notice anything that has changed much. They continue to go for the whole enchilada.
A.1.2 Each of the last four decades has been successively warmer than any decade that preceded it since 1850.
If the satellite temperature anomalies are taken into account, then the last decade (2012-2022) shows no increase at all ... after a dramatic 6-year decline from the peak of the 2016 El Nino. Of course they do not take these into account. The UAH anomaly scale is the right axis.
A.1.6 It is virtually certain that the global upper ocean (0–700 m) has warmed since the 1970s and extremely likely that human
influence is the main driver. If you look at the entire UAH satellite record in conjunction with ENSO, it seems perfectly clear to me that atmospheric temperature anomalies in the tropical lower troposphere follow ENSO with a lag ... as do global troposphere anomalies. These have been trending consistently downward for the last 6 years.
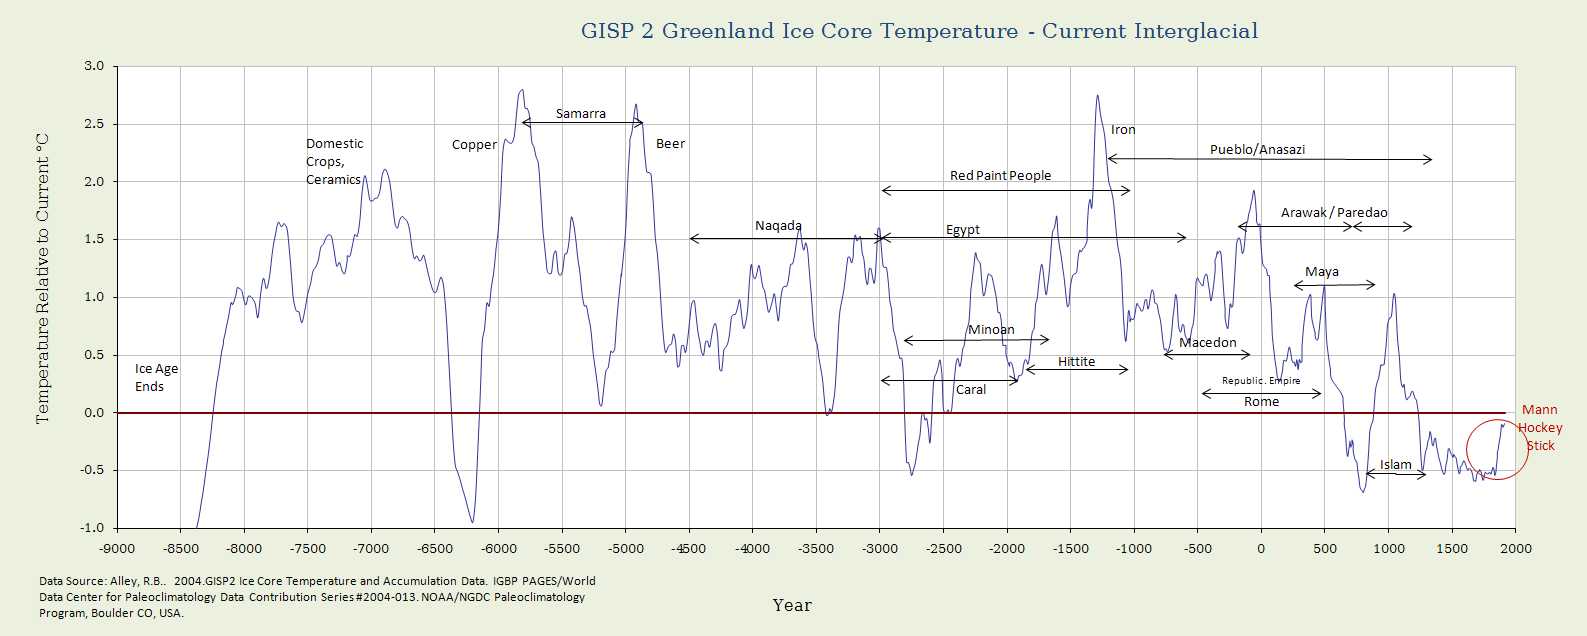
Human influence has warmed the climate at a rate that is unprecedented in at least the last 2000 years A.2.2 Global surface temperature has increased faster since 1970 than in any other 50-year period over at least the last 2000
years (high confidence).
If taken in context to other databases such as GISP 2, this is Mannish BS.
All in all ... PT Barnum was right.
 |
|
|
|
Post by ratty on Sept 11, 2022 1:26:27 GMT
What does "doubling down" mean wrt climate science?
|
|
|
|
Post by missouriboy on Sept 11, 2022 3:13:20 GMT
What does "doubling down" mean wrt climate science? Double Scotch I think. Ya have to have something to get past the smell.  |
|
|
|
Post by nonentropic on Sept 11, 2022 4:38:55 GMT
bit early but the Pino Gris is flowing.
|
|
|
|
Post by ratty on Sept 11, 2022 4:47:21 GMT
bit early but the Pino Gris is flowing. I need some Pinot More.    |
|
|
|
Post by nonentropic on Sept 11, 2022 9:33:08 GMT
plumbing constraints!
|
|
|
|
Post by duwayne on Sept 17, 2022 13:43:22 GMT
The Final IPCC Sixth Assessment Report (AR6) will be issued sometime in the next several months. The Summary for Policymakers on the Physical Science Basis of Climate Change portion of the study has been out for some time with minimal fanfare.
There are 2 more working group reports.
1)Impacts, Adaptation, and Vulnerability 2)Mitigation of Climate Change
The Final Overall Summary Report is scheduled for later on.
This is the key chart from the Physical Science summary.

The thing that is obvious to me and probably many others from the above chart is that the models are very inaccurate and they overstate warming.
The inaccuracy shows up in the error bar range which in the case of the “observed” in 2020 is about 1.0C or about the same as the total warming since 1950 when atmospheric CO2 growth began in earnest. Im not saying that this means there may be no greenhouse gas effect. But I am highlighting the inaccuracy in the models.
Moreover, the rate of increase in the average of the modeled temperature over the past couple of decades is significantly higher than the observed average even though the modelers knew what the rate of increase was. This can be seen by the higher slope of the model numbers compared to the observed over the past 2 decades. If modelers weren't already given the answer, one would suspect their predictions would have been considerably worse given the error range of the models.
Normally, anyone wanting to know the ability of a model to predict the future would want to see how past predictions turned out. This chart avoids that embarrassing detail.
Instead the chart is based on the latest model numbers where any modeler with any brains is smart enough to adjust his model so the last year is close to correct. You can’t have the last year be way off and expect to get financing.
But why would the modeler overstate the temperature growth due to greenhouse gases as is apparent in the chart? Does that not affect their ability to get financial support?
If the financial supporters are interested in overstating warming would they also be interested in fudging past “observed” data to overstate warming? That would be pretty easy to do.
One final note, this “lipstick on a pig” chart will undoubtedly mislead a bunch of policy makers. And it will be used to mislead the public, sometimes by those who aren't aware of its warts. |
|
|
|
Post by missouriboy on Sept 17, 2022 22:39:53 GMT
The Final IPCC Sixth Assessment Report (AR6) will be issued sometime in the next several months. The Summary for Policymakers on the Physical Science Basis of Climate Change portion of the study has been out for some time with minimal fanfare.
There are 2 more working group reports.
1)Impacts, Adaptation, and Vulnerability 2)Mitigation of Climate Change
The Final Overall Summary Report is scheduled for later on.
This is the key chart from the Physical Science summary.

The thing that is obvious to me and probably many others from the above chart is that the models are very inaccurate and they overstate warming.
The inaccuracy shows up in the error bar range which in the case of the “observed” in 2020 is about 1.0C or about the same as the total warming since 1950 when atmospheric CO2 growth began in earnest. Im not saying that this means there may be no greenhouse gas effect. But I am highlighting the inaccuracy in the models.
Moreover, the rate of increase in the average of the modeled temperature over the past couple of decades is significantly higher than the observed average even though the modelers knew what the rate of increase was. This can be seen by the higher slope of the model numbers compared to the observed over the past 2 decades. If modelers weren't already given the answer, one would suspect their predictions would have been considerably worse given the error range of the models.
Normally, anyone wanting to know the ability of a model to predict the future would want to see how past predictions turned out. This chart avoids that embarrassing detail.
Instead the chart is based on the latest model numbers where any modeler with any brains is smart enough to adjust his model so the last year is close to correct. You can’t have the last year be way off and expect to get financing.
But why would the modeler overstate the temperature growth due to greenhouse gases as is apparent in the chart? Does that not affect their ability to get financial support?
If the financial supporters are interested in overstating warming would they also be interested in fudging past “observed” data to overstate warming? That would be pretty easy to do.
One final note, this “lipstick on a pig” chart will undoubtedly mislead a bunch of policy makers. And it will be used to mislead the public, sometimes by those who aren't aware of its warts. That pretty much sums it up. In the old days those who wanted "answers" would just summon the Gods via their Earthly priests. Undoubtedly the priests understood what was expected of them. But being pragmatic, I'm sure that the priests would make their interpretations sufficiently vague to allow for CYA. These guys (the modelers) are wayyyyy out there. Justice would see a bunch of limbs (models) cut off with the pilots still in the drivers seat. |
|
|
|
Post by blustnmtn on Sept 26, 2022 14:31:55 GMT
|
|
|
|
Post by missouriboy on Sept 26, 2022 16:49:39 GMT
The customer is always right. And some customers are pickier than others. Back in high school I was a "pit cook" at a local steak house. We had a gentleman and his wife that came in for steaks every week. His steak request could be described as ... "spank its butt and put it on a plate". We quickly learned that this was non-negotiable. Spank it too hard and it came back, along with an angry waitress that was concerned for her tip. Modelers are too much pit cook and not enough scientist.
|
|
|
|
Post by ratty on Sept 27, 2022 5:29:59 GMT
|
|
|
|
Post by blustnmtn on May 14, 2023 21:10:50 GMT
clintel.org/thorough-analysis-by-clintel-shows-serious-errors-in-latest-ipcc-report/“The IPCC ignored crucial peer-reviewed literature showing that normalised disaster losses have decreased since 1990 and that human mortality due to extreme weather has decreased by more than 95% since 1920. The IPCC, by cherry picking from the literature, drew the opposite conclusions, claiming increases in damage and mortality due to anthropogenic climate change. These are two important conclusions of the report The Frozen Climate Views of the IPCC, published by the Clintel Foundation. The 180-page report is – as far as we know – the first serious international ‘assessment’ of the IPCC’s Sixth Assessment Report. In 13 chapters the Clintel report shows the IPCC rewrote climate history, emphasizes an implausible worst-case scenario, has a huge bias in favour of ‘bad news’ and against ‘good news’, and keeps the good news out of the Summary for Policy Makers. The errors and biases that Clintel documents in the report are far worse than those that led to the investigation of the IPCC by the Interacademy Council (IAC Review) in 2010. Clintel believes that the IPCC should reform or be dismantled.”
|
|
|
|
Post by Sigurdur on May 15, 2023 11:41:31 GMT
Clouds are one of the biggest question marks in global climate models, and a wild card in predicting what will happen to the climate as temperatures rise. They play a vital role in how much of the sun's radiation makes it into and gets trapped in our atmosphere. The more clouds phys.org/news/2020-11-cloud-formations-impact-global-dont.html |
|