|
|
Post by nonentropic on Oct 23, 2023 17:49:19 GMT
Its all about the area under the curve 24 had a long period at its lower than usual peak.
Clearly we now need a little time probably at least a year.
|
|
|
|
Post by missouriboy on Oct 23, 2023 23:26:29 GMT
I don't want to speak for Acidohm, but I suspect he is not looking for a higher "second peak" because the first peak will have been "juiced up" by concurrent peaks in the 2 hemispheres. It's looking to me like the first peak will be close to Svalgaard's prediction. Therefore Svalgaard's forecast is looking good.
A second peak could come in at near the same level.
There won't be 2 peaks this cycle Duwayne, hemispheres are in sync. We are going to demand that "they" name a solar process effect after you Mark.  |
|
|
|
Post by acidohm on Oct 24, 2023 4:34:50 GMT
There won't be 2 peaks this cycle Duwayne, hemispheres are in sync. We are going to demand that "they" name a solar process effect after you Mark.  Well...only another 3 or 4 years to see what happens 😉 I think total ssn number for this cycle will be lower than the last. |
|
|
|
Post by missouriboy on Oct 25, 2023 22:15:53 GMT
I don't want to speak for Acidohm, but I suspect he is not looking for a higher "second peak" because the first peak will have been "juiced up" by concurrent peaks in the 2 hemispheres. It's looking to me like the first peak will be close to Svalgaard's prediction. Therefore Svalgaard's forecast is looking good. A second peak could come in at near the same level.
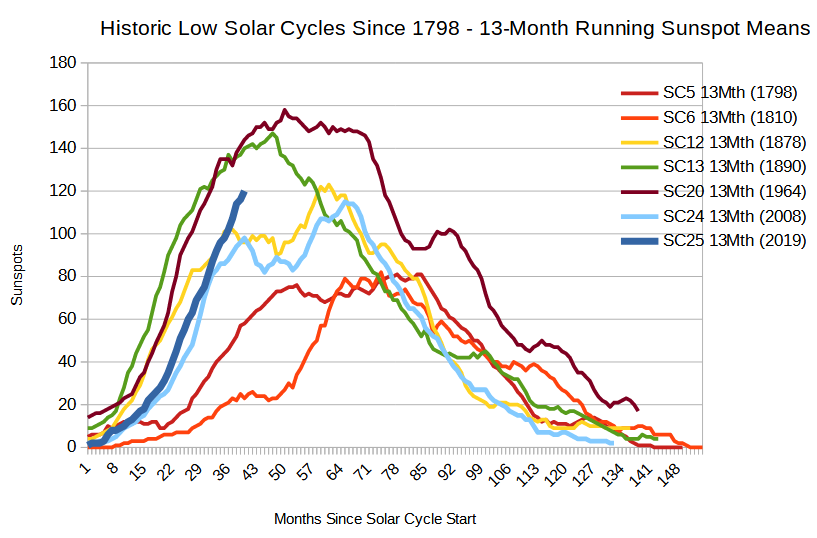
There won't be 2 peaks this cycle Duwayne, hemispheres are in sync. The historic low solar cycles. The SC 24 and 25 cycles are looking very similar to SC 12 and 13.  |
|
|
|
Post by neilhamp on Oct 30, 2023 7:46:56 GMT
|
|
|
|
Post by Sigurdur on Oct 31, 2023 22:16:04 GMT
|
|
|
|
Post by flearider on Nov 1, 2023 7:52:02 GMT
£20 that it ends in 2028-2030 time frame .. and we will see a big drop off after max like sc 13 .. it's going to get cold .. or why else would the be shoveling more control on us  |
|
|
|
Post by missouriboy on Nov 6, 2023 17:11:04 GMT
Found this image of solar cycle series of hemispheric sunspots BY AREA. I cannot find a time series by area data set on Silso or elsewhere.  |
|
|
|
Post by duwayne on Nov 7, 2023 18:42:04 GMT
Found this image of solar cycle series of hemispheric sunspots BY AREA. I cannot find a time series by area data set on Silso or elsewhere.  I assume the sunspot area numbers correlate pretty well with the sunspot numbers. Is this the case?
Incidently, the 13 year period was chosen for calculating the smoothed sunspot numbers because it most closely correlates with the 13-month smoothed 10.7 CM Solar Radio Flux which is a measure of the solar radiation reaching the earth.
|
|
|
|
Post by code on Jan 26, 2024 2:08:34 GMT
|
|
|
|
Post by missouriboy on Jan 26, 2024 3:21:34 GMT
Might get "mighty cold". This has been posted before, but I do so again as it remains the best comprehensive discussion / quantification of a large range of solar variables that likely affect our planet. It is much more than just sunspots. Their guesswork is the normal progression of science.
|
|