|
|
Post by missouriboy on Mar 20, 2024 14:12:12 GMT
Thanks for the effort Neil. You may have accessed an extremist-central projection from the '90s? Yet they get the dips in the right place when plotted against the last "Official" AMO file I have. I could call it "Starship AMO'.  It's NOAA and the date on the v5 sub-directory is February 2024 for what that's worth. And that file shows a last-modified date of 3-3-24.  |
|
|
|
Post by duwayne on Mar 20, 2024 18:00:24 GMT
Thanks for the effort Doug. You may have accessed an extremist-central projection from the '90s? Yet they get the dips in the right place when plotted against the last "Official" AMO file I have. I could call it "Starship AMO'. It's NOAA and the date on the v5 sub-directory is February 2024 for what that's worth. And that file shows a last-modified date of 3-3-24. The "old" AMO was detrended. I wonder if the "new" AMO is detrended. It looks like it may not be. |
|
|
|
Post by nonentropic on Mar 20, 2024 18:59:42 GMT
The SOI is very easily calculated and also probably uncorruptible.
As a consequence they dare not fiddle with it, the two pressures are in all likelihood privately aggregated as a way of ensuring quality.
How is the AMO calculated and could it be done privately?
|
|
|
|
Post by blustnmtn on Mar 20, 2024 21:41:53 GMT
The SOI is very easily calculated and also probably uncorruptible. As a consequence they dare not fiddle with it, the two pressures are in all likelihood privately aggregated as a way of ensuring quality. How is the AMO calculated and could it be done privately? I thought the AMO data was derived from an ensemble of buoy based temperature sensors. Am I wrong? |
|
|
|
Post by missouriboy on Mar 20, 2024 21:50:17 GMT
This page explains the problem and the general method. Of course, it says nothing about what this particular data file is.
|
|
|
|
Post by nonentropic on Mar 21, 2024 9:32:03 GMT
I went to Chat GPT and they indicate that unlike the SOI the AMO is a little less "precise" and is a series of "interpreted" temperatures subject to opportunity for selective input. I think it's currently being homogenized.
|
|
|
|
Post by blustnmtn on Mar 21, 2024 10:02:50 GMT
Mann argues that the AMO doesn’t exist. There may well be political pressure to stop publishing data suggesting that it does exist.
|
|
|
|
Post by neilhamp on Mar 21, 2024 11:22:54 GMT
Hi again Missouriboy, I see you have managed to plot the data in a chart. When I try to download the data into EXCEL it comes in as a complete string "1854 1 0.28" Am I doing something wrong. Is there a way to handle the data to enable me to produce a chart similar to yours. I follow the AMO v global temperature chart at woodforthetrees (see below)   www.woodfortrees.org/plot/hadcrut4gl/from:1850/to:2023/plot/esrl-amo/from:1850/to:2023 www.woodfortrees.org/plot/hadcrut4gl/from:1850/to:2023/plot/esrl-amo/from:1850/to:2023I am waiting for the AMO to start to fall. It doesn't seem to be happening. Neil |
|
|
|
Post by missouriboy on Mar 21, 2024 12:51:43 GMT
Hi again Missouriboy, I see you have managed to plot the data in a chart. When I try to download the data into EXCEL it comes in as a complete string "1854 1 0.28" Am I doing something wrong. Is there a way to handle the data to enable me to produce a chart similar to yours. I follow the AMO v global temperature chart at woodforthetrees (see below) www.woodfortrees.org/plot/hadcrut4gl/from:1850/to:2023/plot/esrl-amo/from:1850/to:2023I am waiting for the AMO to start to fall. It doesn't seem to be happening. Neil Hi Neil. I just use the LibreOffice spreadsheet. Excel should work the same. Opened the file-link you sent me in Firefox - highlight copied the data with my mouse - selected a cell in the spreadsheet where I wanted the data to start - then did a "paste special" with the unformatted text option. It interprets the spaces in the file as delimiters. And "presto" ... you have a formatted digital file. |
|
|
|
Post by duwayne on Mar 21, 2024 16:40:33 GMT
I'm 99% certain the "unknown" AMO data is not detrended. To detrend the unknown data....
From Missouriboy's chart above, the slope of the difference between the 2 AMO's is about 0.6 for 60 years or 0.01 per year.
I would subtract 0.5 from the current "unknown AMO" to estimate what the "Old AMO" would be for 2024.
Then I'd add (or subtract) 0.01 to the 0.5 adjustment for each year after (or before) 2024. That's 0.6 divided by 60 to get the slope of 0.01 per year.
The unknown values will have to fall to about 0.5 for the old AMO numbers to get down to zero on the old basis.
|
|
|
|
Post by code on Mar 21, 2024 17:06:13 GMT
Not sure where to put this article so here it goes Extreme cold is killing millions of livestock animals in Mongolia, says Red Cross The Red Cross says about 4.7 million animals have died because of extreme cold and snow Philip Drost · CBC Radio · Posted: Mar 20, 2024 2:43 PM PDT | Last Updated: March 20 www.cbc.ca/radio/asithappens/red-cross-livestock-1.7150138 |
|
|
|
Post by missouriboy on Mar 21, 2024 22:58:48 GMT
Repeat of the post-peak La Ninas of SC20? Or there abouts?
First 82 months of solar cycles 19 - 25. 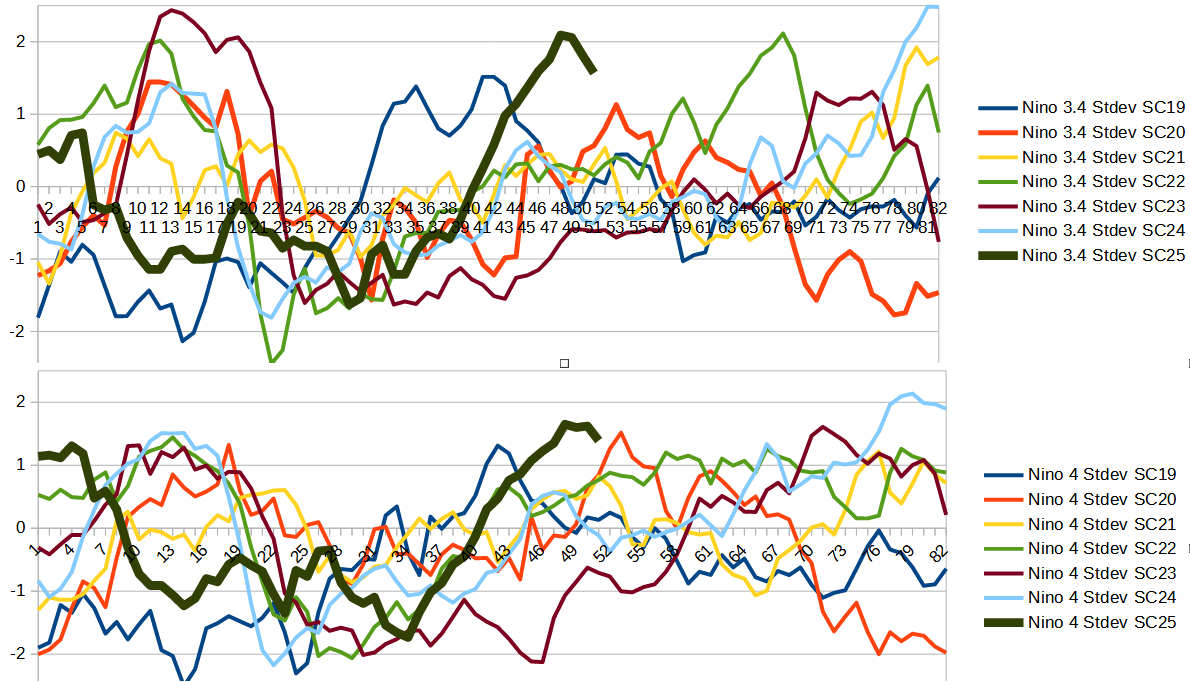 |
|
|
|
Post by ratty on Mar 22, 2024 6:25:28 GMT
Not sure where to put this article so here it goes Extreme cold is killing millions of livestock animals in Mongolia, says Red Cross The Red Cross says about 4.7 million animals have died because of extreme cold and snow Philip Drost · CBC Radio · Posted: Mar 20, 2024 2:43 PM PDT | Last Updated: March 20 www.cbc.ca/radio/asithappens/red-cross-livestock-1.7150138Maybe there IS a climate crisis, a cold one? |
|
|
|
Post by missouriboy on Mar 23, 2024 0:23:19 GMT
Watch out Gulf of Mexico. |
|
|
|
Post by ratty on Mar 23, 2024 5:01:43 GMT
Watch out Gulf of Mexico. Maybe he will be as wrong as the BoM was in predicting drought last year? |
|


 It's NOAA and the date on the v5 sub-directory is February 2024 for what that's worth. And that file shows a last-modified date of 3-3-24.


