|
|
Post by blustnmtn on Jul 29, 2021 12:55:32 GMT
And now it's SPOTLESS!
|
|
|
|
Post by missouriboy on Jul 31, 2021 17:06:13 GMT
Average daily monthly sunspots for July 2021 are still right on the SC24 trend line. That magical termination event is still elusive. |
|
|
|
Post by missouriboy on Sept 1, 2021 18:02:03 GMT
Average daily monthly sunspots for August is lower than for July. The trend for SC25 since Dec. 2019 shows no sign of varying from the SC24 trend.
|
|
|
|
Post by acidohm on Sept 1, 2021 19:28:11 GMT
|
|
|
|
Post by missouriboy on Sept 3, 2021 1:58:01 GMT
The following is a map posted on Adapt2030, supposedly showing areas of the US electrical grid that were expected by our government to go down in the case of a major EMP from the sun. No source detail mentioned. Color designations not identified. 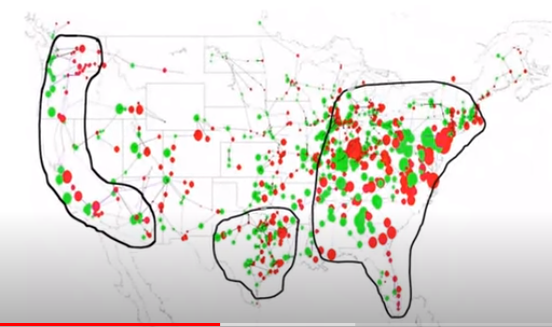 |
|
|
|
Post by blustnmtn on Sept 7, 2021 20:29:06 GMT
|
|
|
|
Post by missouriboy on Sept 7, 2021 21:32:19 GMT
In fact, the image above is only a fraction of the total. The whole sunspot is enormous. AR2868 sprawls more than 110,000 km from end to end.
Austria's moment of atmospheric clarity combined with the sheer scale of the sunspot allowed Karrer to capture details rarely seen in amateur photos. There's the dark umbra, the filamentary penumbra, a crack in the sunspot known as a "light bridge," dark pores, and boiling granules the size of North America.But it's NO match for CO2! Just wanted you to know that Blu. 
|
|
|
|
Post by neilhamp on Sept 8, 2021 9:56:50 GMT
acidohm,
Is that your comparative graph?
If not, is it available on line?
|
|
|
|
Post by youngjasper on Sept 9, 2021 15:34:13 GMT
|
|
|
|
Post by acidohm on Sept 9, 2021 18:09:04 GMT
acidohm, Is that your comparative graph? If not, is it available on line? As Youngjasper said ⬆️ Well worth browsing through the site, it's very good! |
|
|
|
Post by neilhamp on Sept 10, 2021 6:33:51 GMT
acidohm,
Thanks for the info.
In my bookmarks now
Great site
neil
|
|
|
|
Post by farmerpipes on Sept 14, 2021 11:51:42 GMT
sc25 zoomed briefly to 125 over the weekend, and F10.7 to 100! Good to see.
|
|
|
|
Post by missouriboy on Sept 14, 2021 17:02:41 GMT
sc25 zoomed briefly to 125 over the weekend, and F10.7 to 100! Good to see. Then immediately dropped again ... Still warming up. Another 6 months or so if it stays like SC24 ... meaning after the El Nina winter. SC23 kicked in slightly earlier. Would be interesting though to see what effect it might have on the Nina if it kicked in earlier. Chart is through August. Silso 2021 09 01 2021.667 33 8.2 24 30 2021 09 02 2021.670 33 3.0 34 43 2021 09 03 2021.673 22 7.3 36 44 2021 09 04 2021.675 68 12.4 35 42 2021 09 05 2021.678 73 7.7 36 44 2021 09 06 2021.681 83 6.9 29 40 2021 09 07 2021.684 81 9.5 32 41 2021 09 08 2021.686 96 6.9 34 43 2021 09 09 2021.689 96 9.0 27 35 2021 09 10 2021.692 94 8.7 23 30 2021 09 11 2021.695 73 10.7 23 28 2021 09 12 2021.697 48 9.2 27 32 2021 09 13 2021.700 32 2.8 28 33 2021 09 14 2021.703 23 1.9 21 27 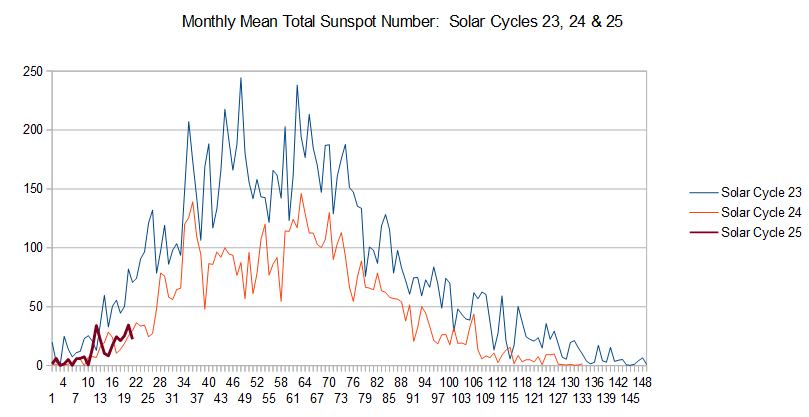 |
|
|
|
Post by missouriboy on Sept 15, 2021 0:49:04 GMT
|
|
|
|
Post by missouriboy on Oct 1, 2021 20:15:21 GMT
September sunspots jumped to 51. So far it's been playing around ... one up, one down. We'll see.
UAH global went to +0.25. When it drops, it should be a biggie ... but you just never know for sure.
|
|


